 "
"
Modeling
From 2009.igem.org

| Home|Project|Team |Protocols | Parts | Modeling | Gallery |Notebook|Ethics| |
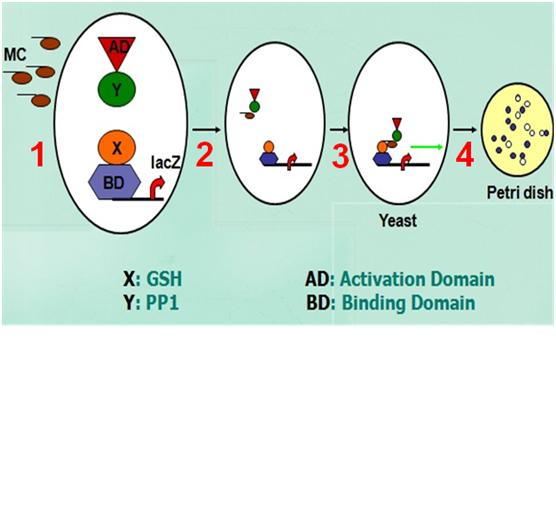
- Here is something about modeling of the microcystin-detecting system. First, we separate the whole process into 4 steps. Step1, the entrance of MCs into yeast cells should be supposed whether free diffusion, facilitated diffusion, or active transport. Step 2, we should know whether there is a balance or not between the concentration of MCs and that of the compound of MCs+AD. Step 3, the possibility of the combination of AD-Y+MCs and BD-X and hill equation of the promoter activated by the compound should be considered. Step 4, the relationship between the concentration of the protein and the phenomenon seen outside is also significant to the effectiveness of the whole system.

• Why should we consider the first step and second step together? Because the transport of molecules through membrane should conform to Fick’s first law. So the concentration of MCs inside the cell will be influenced by that outside and the reactions inside the cells can conversely influence the concentration of MCs outside. We may find step2 follows intimately step1 and can also decide the features of step1. All in all, we cannot analyze one of the two steps without the other.
• Based on this conclusion, we should determine how the transportation of molecules of MCs through membrane happens. We all know there are three kinds of transportation through membrane, namely, free diffusion, facilitated diffusion, and active transport. We may easily fine only gas molecules, non-polar small molecules, and water can pass the membrane in this free diffusing way, so this way is not our requirement. So the peptides pass membrane in which ways, whether facilitated diffusion or active transport, is the problem we discuss here.


• According to the thermodynamics of the transporting process, we can see if the concentration outside is much higher than that inside, we can suppose this process is a facilitated diffusion because it does not need extra energy coming from ATP. • Based on this, we suppose the trans-membrane process in our idea is probably a facilitated diffusion and there are three kinds of situations in this process. The A model, toxin peptides are transported and accumulated, and then bind the compound of AD-Y. This model is apparently wrong, which doesn’t accord to Fick’s law said above, although we can describe this model thoroughly. The model B means that toxins peptides bind AD-Y immediately they are transported through membrane. The model C means that toxins peptides inside and outside the cells come to a balance because of the binding of AD-Y and the peptides. Let’s analyze B and C separately.


• First, model B. we can see there are gradients of substrate toxin peptides and carrier proteins between the abiotic phase and biotic phase. We can get this equation which can describe this process entirely. And we can find the transporting rate conform to this formulation.


• Here we discuss the methods of determining the parameters through experiments. If we take data in this way we may get two straight lines related to the two main parameters. And we can find concentration inside is lower than the difference of whole concentration and that outside.

• Through matlab, we can this picture. As the yeast cells grow exponentially, we can get changing curves of concentration outside and inside the cells. In the late period, we can find this blue curve is determined mainly by Cs,a instead of e in earlier phase.

This picture merely represents the changing tendencies of cell numbers and concentrations of MCs inside and outside the yeast cells. Since the idea is innovative, we cannot ensure values of all the parameters in this idea and so may decide the values of some parameters only through experiments. However, the changing tendencies of all the molecules and cells can be described by the this picture.
• This is model C. The toxin peptides inside cannot be zero because there is a balance between the compound and the binding parts. So we get this equation.


We can use matlab to model the new situation ② as follows.
• Here is the picture, we can suppose the entrancing rate of peptides equals the exiting rate, and we can find the peptides accumulate in the cells.

• Here we must consider whether active transport is probable. We can find there are changeable ways between facilitated diffusion and active transport. For example, when the concentration of glucose outside intestinal cells is higher than that inside, the molecules are transported in facilitated diffusing way. On the other hand, when the concentration outside is lower, the molecules pass membrane in active transporting way. So we should discuss this possibility.

Through this picture in some book, we can find when the concentration inside is lower than that outside there is a straight line between concentration inside and the time. Uridine, a-TEG, maltotriose, and succinate are known to be transported through membranes of yeast cells actively and they all conform to this kind of proportional relationship.


• This is the third step. According to both Statistical thermodynamics and direct approximation method, we can get the same conclusion that concentration of the compound equals a constant multiplying concentration of peptides.

• If modicum of AD-Y that have not bund peptides can also be close to BD-X, we should consider this possibility. Finally, we can find the concentration of compound also equals a constant multiplying concentration of peptides inside the cells.

• The fourth step, we use hill equation to describe the promoter activated and the protein expressed. The final strength seen outside is S, which has a correlation with cprotein that can be described by a parameter Ks.

• When the amount of the protease is excessive, we can directly use the extent of blue color to define the different concentrations of toxin. However, what can we do if we find the color on the petri dish is not uniform?
• We can use a method to detect the amount of protease according to what this equation. The enzyme activity of the protease conforms to: • On the other hand, if we cannot ensure that the amount of protease is always excessive in experiments, we should use the intact Michaelis-Menten equation to describe this process. In this way we can also get the parameter through experiment.

• Since the fourth step is relatively independent compared with the first three steps, we combine the first three steps together nd get these three pictures, through which we can see the changing tendency of concentration of protease.

• This is a summary. We have three models of toxin peptides transportation through membrane, two situations of combining of the two parts, and two methods of detecting the concentration of protease.

Although we just finished building the system and obtained a qualitative sequence, we can detect the parameters in our modeling and determine the whole process more precisely through experiments.