 "
"
File:CellautoWiki1.png
From 2009.igem.org
Size of this preview: 800 × 409 pixels
Full resolution (1,358 × 695 pixels, file size: 65 KB, MIME type: image/png)
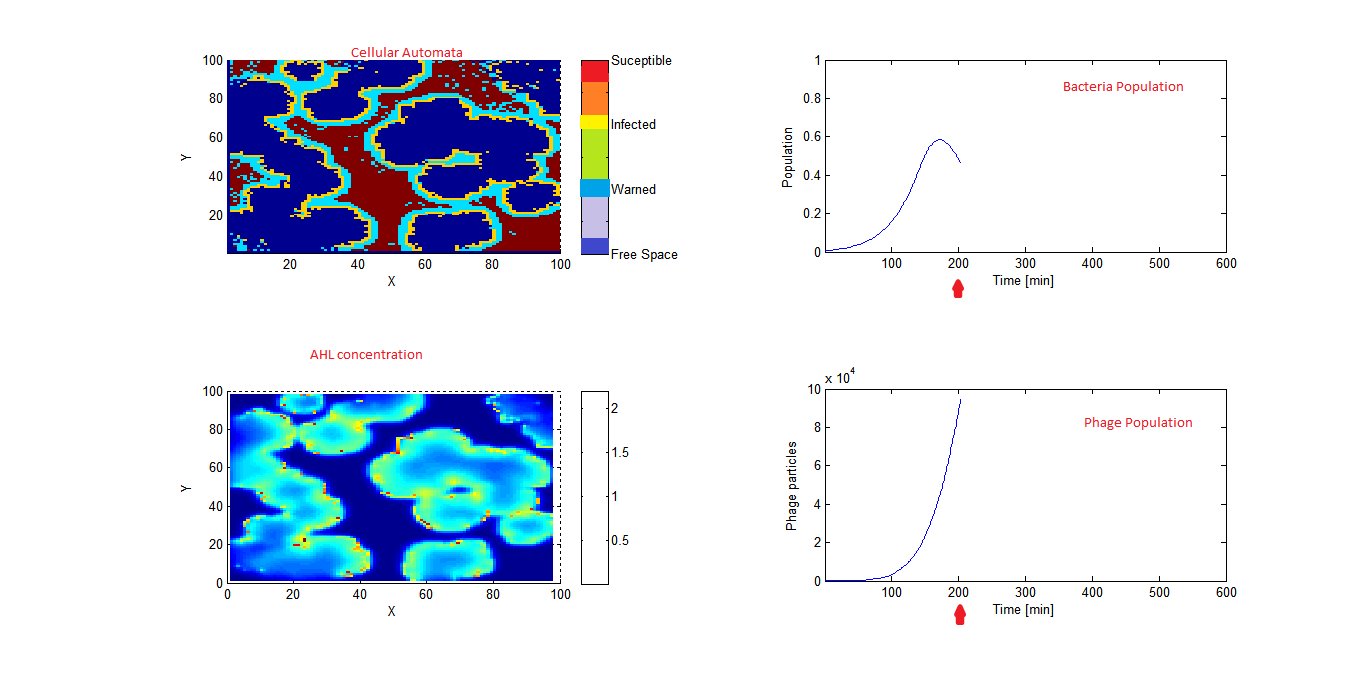
Cellular Automata Output Left-Up: bacteria representation the state is indicated by the color. Right-Up: Bacteria Growth Curve, population size is relative to the charge capacity. Left-Down: AHL concentration in enviroment. Right-Down: Phage Growth Curve. Image was captured at time = 208 min. Grid Size = 100x100
File history
Click on a date/time to view the file as it appeared at that time.
| Date/Time | Thumbnail | Dimensions | User | Comment | |
|---|---|---|---|---|---|
| current | 16:58, 16 October 2009 | | 1,358×695 (65 KB) | Agranado (Talk | contribs) | (Cellular Automata Output Left-Up: bacteria representation the state is indicated by the color. Right-Up: Bacteria Growth Curve, population size is relative to the charge capacity. Left-Down: AHL concentration in enviroment. Right-Down: Phage Growth Curve.) |
File links
The following page links to this file: