From 2009.igem.org
(Difference between revisions)
|
|
| Line 1: |
Line 1: |
| - | [[Image:Ribosome_in.jpg|thumb|600px|center|Ribosome inactivation rate dependence of the Burst size. The means of the burst sizes are plotted versus the parameter of ribosome inactivation rate caused by colicin E3. The model is remarkably robust over a broad range of ribosome inactivation parameter values. X axis log scaled.]] | + | [[Image:Ri.jpg|thumb|600px|center|Ribosome inactivation rate dependence of the Burst size. The means of the burst sizes are plotted versus the parameter of ribosome inactivation rate caused by colicin E3. The model is remarkably robust over a broad range of ribosome inactivation parameter values. X axis log scaled.]] |
| | | | |
| | | | |
| - | [[Image:Ribosome_in_var.jpg|600px|thumb|center|Ribosome inactivation rate dependence of the Burst size. The means of the burst sizes are plotted versus the parameter of ribosome inactivation rate caused by colicin E3. Dispersion bars represents standard deviation of the means. The model is remarkably robust over a broad range of ribosome inactivation parameter values. X axis log scaled.]] | + | [[Image:Ri_var.jpg|600px|thumb|center|Ribosome inactivation rate dependence of the Burst size. The means of the burst sizes are plotted versus the parameter of ribosome inactivation rate caused by colicin E3. Dispersion bars represents standard deviation of the means. The model is remarkably robust over a broad range of ribosome inactivation parameter values. X axis log scaled.]] |
Latest revision as of 16:41, 21 October 2009

Ribosome inactivation rate dependence of the Burst size. The means of the burst sizes are plotted versus the parameter of ribosome inactivation rate caused by colicin E3. The model is remarkably robust over a broad range of ribosome inactivation parameter values. X axis log scaled.
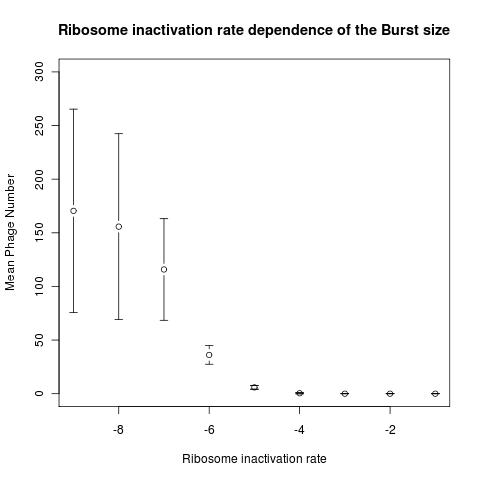
Ribosome inactivation rate dependence of the Burst size. The means of the burst sizes are plotted versus the parameter of ribosome inactivation rate caused by colicin E3. Dispersion bars represents standard deviation of the means. The model is remarkably robust over a broad range of ribosome inactivation parameter values. X axis log scaled.
 "
"

