 "
"
Team:Stanford/ModelingPage
From 2009.igem.org

| Home | Project | Modeling | Parts | Notebook | Team | SBOL-V |
<center>
Our modeling team consisted of Leon Lin and Mary Yang.


Contents |
Goal
- To model and optimize the kinetics of these devices.
- Population dynamics: analyze the conditions to switch between Th17 and Tregs.
- To predict the results of experiments which we could not perform in the lab
-

Anti-Inflammatory Device
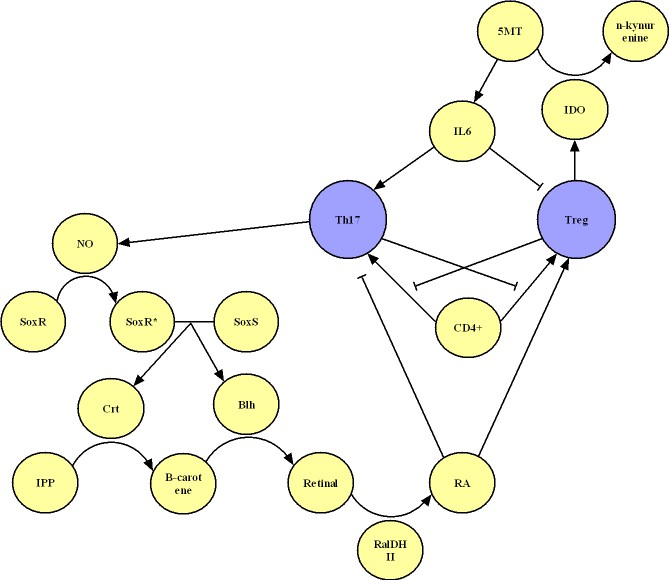
The IPP-->B-carotene-->RA Model

<center>Fig 2.1 A quick sketch of the IPP-->RA process</center>

The process above can be devided into two procedures:
- IPP*8-->B-carotene
- B-carotene(+Blh)-->Retinal(+RalDH)-->Retinoic Acid
Modeling on the production of B-carotene
The process of IPP producing B-carotene is quite complex, as shown in the Fig 2.2.
In this process, we basically care about two main issues:
- Yield output of B-carotene ([B-carotene]/[All Caronoids]).
- Velocity of the whole process
Yield output of B-carotene
We found the B-carotene distribution in yeast in [1]. Below is an important form as to the issue.

<center>Form 2.1 B-carotene distribution [1]</center>
Basically, using the cluster of "YB/I/E I", in the final product of caronoids, we get 68% of B-carotene, highest percentage in the paper. (Also 29% Phytoene, and 3% Neurosporene.) "YB/I/E tHMG1 I", producing 52% of B-carotene, might be another choice.
Production rate of B-carotene
As this is a really long process....Basically, the velocity is mainly dependent on the most time-consuming reaction in the whole chain. Thus, Leon and I looked for the kcat values of different enzymes in the procedure, as shown in the cart below:

<center>Form 2.2 Paremeters in the IPP-->B-carotene model. (Source: mostly from Brenda)</center>
Apparently, cyclization of Lycopene is the slowest reaction, as the concentration of enzymes are approximately in the same level.

Modeling on the B-carotene-->RA process
The production of RA is mainly based on a chain of two catalyzed reactions, as shown in the graph below:

<center>Fig 2.3 The production of RA</center>
Neither Retinal nor RA has any other degrading process in E.coli. Degrading rate of B-carotene is 9.769e-9 s^-1. Other paremeters we use in this model are shown in the form below:

<center>Form 2.3 Parameters used in the B-carotene-->RA model</center>
Simulation and Analysis
- Equations for the IPP-->RA process:

References
[1] High-Level Production of Beta-Carotene in Saccharomyces cerevisiae by Successive Transformation with Carotenogenic Genes from Xanthophyllomyces dendrorhous. APPLIED AND ENVIRONMENTAL MICROBIOLOGY, July 2007, p. 4342–4350
- NO->SoxS-SoxR Model
Anti-Immunosuppresion Device
Models of the Tryptophan System
Wild Type Model Ignoring Cooperativity

Wild Type Model Including Cooperativity
</center>
File:Project Overview.jpg