 "
"
Team:Uppsala-Sweden/Modelling
From 2009.igem.org
(Difference between revisions)
m (→Modelling of ethanol production) |
m (→Modelling of ethanol production) |
||
| Line 12: | Line 12: | ||
2. Assuming quasi steady state (Michaelis Menten Chinetics | 2. Assuming quasi steady state (Michaelis Menten Chinetics | ||
| - | e0=e+es | + | e0=e+es |
| - | [[Image:ek_1_2.png]] | + | [[Image:ek_1_2.png]] |
Having the Km and Kcat values gives e0 from level of product formation. | Having the Km and Kcat values gives e0 from level of product formation. | ||
| - | [[Image:ek_3.png]] | + | [[Image:ek_3.png]] |
Having e0 and letting kt go towards zero, (kt here represents the rate at which our substrate pyruvate "disappears" into the Krebbs cycle), gives ks | Having e0 and letting kt go towards zero, (kt here represents the rate at which our substrate pyruvate "disappears" into the Krebbs cycle), gives ks | ||
| - | [[Image:ek_4.png]] | + | [[Image:ek_4.png]] |
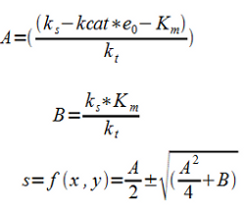
Assuming Ks to be constant within the interval and assuming steady-state | Assuming Ks to be constant within the interval and assuming steady-state | ||
| - | [[Image:ek_5.png]] | + | [[Image:ek_5.png]] |
S is a function of f(x,y) where x is proportional to e0 and y is proportional to kt | S is a function of f(x,y) where x is proportional to e0 and y is proportional to kt | ||
| - | [[Image:ek_6.png]] | + | [[Image:ek_6.png]] |
| + | Measure for different x and y and fit the function | ||
| + | [[Image:ek_6.png]] | ||
{{Uppsala-Sweden_Footer}} | {{Uppsala-Sweden_Footer}} | ||
Revision as of 09:21, 20 October 2009

Modelling of ethanol production
For our modell we have some basic assumptions that are
1. Co-evolution of the of the ethanol producing pathway, making km and kcat being highly similar for pdc as well as ADH
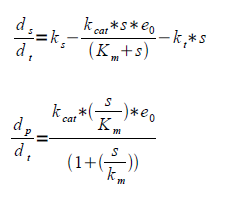
2. Assuming quasi steady state (Michaelis Menten Chinetics
e0=e+es

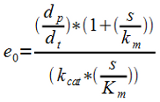
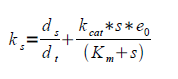
Having the Km and Kcat values gives e0 from level of product formation.

Having e0 and letting kt go towards zero, (kt here represents the rate at which our substrate pyruvate "disappears" into the Krebbs cycle), gives ks

Assuming Ks to be constant within the interval and assuming steady-state
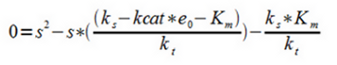

S is a function of f(x,y) where x is proportional to e0 and y is proportional to kt

Measure for different x and y and fit the function