EPF-Lausanne/11 September 2009
From 2009.igem.org
(→Wet Lab) |
|||
| (9 intermediate revisions not shown) | |||
| Line 9: | Line 9: | ||
<input type="button" name="lien" value="10 September 2009" | <input type="button" name="lien" value="10 September 2009" | ||
onClick="self.location.href='https://2009.igem.org/EPF-Lausanne/10_September_2009'"> | onClick="self.location.href='https://2009.igem.org/EPF-Lausanne/10_September_2009'"> | ||
| - | <input type="button" name="lien" value=" | + | <input type="button" name="lien" value="17 September 2009" |
| - | onClick="self.location.href='https://2009.igem.org/EPF-Lausanne/ | + | onClick="self.location.href='https://2009.igem.org/EPF-Lausanne/17_September_2009'"> |
</p> | </p> | ||
</form> | </form> | ||
| Line 37: | Line 37: | ||
===Results of the characterization=== | ===Results of the characterization=== | ||
RO2-BB #1, all clones were illuminated : | RO2-BB #1, all clones were illuminated : | ||
| - | [[Image:RO2-BB1.jpg|center|RO2-BB#1 plot]] | + | [[Image:RO2-BB1.jpg|center|thumb|upright=4|RO2-BB#1 plot]] |
We have induction (repression repressed...) from LovTAP, we have to investigate further to be sure it is what we want. | We have induction (repression repressed...) from LovTAP, we have to investigate further to be sure it is what we want. | ||
Tryptophan concentration experiment on RO2 : | Tryptophan concentration experiment on RO2 : | ||
| - | [[Image:RO24TRP.jpg|center|RO2#4 TRP plot]] | + | [[Image:RO24TRP.jpg|center|thumb|upright=4|RO2#4 TRP plot]] |
All the clones react in the same way, here it is the graph for RO2#4. It seems we have an increase until somewhere between 2ul and 4 ul (in 50 ul of culture, TRP : 4.25 g/L). | All the clones react in the same way, here it is the graph for RO2#4. It seems we have an increase until somewhere between 2ul and 4 ul (in 50 ul of culture, TRP : 4.25 g/L). | ||
RO2#5 | RO2#5 | ||
| - | [[Image:RO25.jpg|center|RO2#5 plot]] | + | [[Image:RO25.jpg|center|thumb|upright=4|RO2#5 plot]] |
RO2#10 | RO2#10 | ||
| - | [[Image:RO210.jpg|center|RO2#10 plot]] | + | [[Image:RO210.jpg|center|thumb|upright=4|RO2#10 plot]] |
RO1-BB didn't respond. | RO1-BB didn't respond. | ||
RO2#4, influence of TRP and ATC | RO2#4, influence of TRP and ATC | ||
| - | [[Image:RO24TRPATC.jpg|center|RO2#4 TRP ATC plot]] | + | [[Image:RO24TRPATC.jpg|center|thumb|upright=4|RO2#4 TRP ATC plot]] |
Nicolas ce graph n'est pas dans ce que tu nous a envoyé, est-ce que tu peux le rajouter stp ??? | Nicolas ce graph n'est pas dans ce que tu nous a envoyé, est-ce que tu peux le rajouter stp ??? | ||
===Read out 1 characterization=== | ===Read out 1 characterization=== | ||
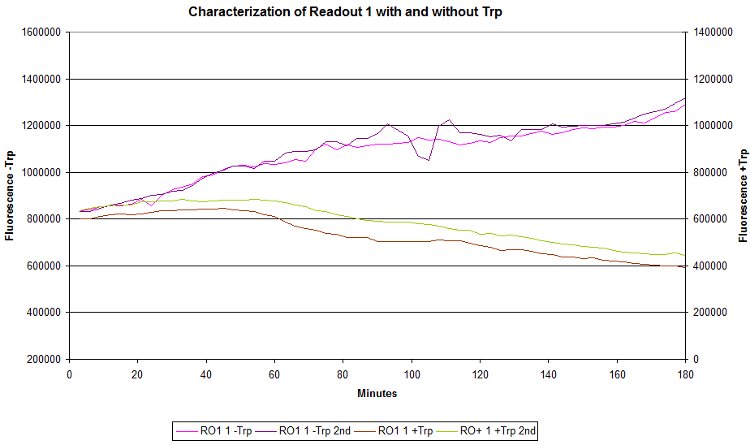
To summarize our results, we did the following graphic : | To summarize our results, we did the following graphic : | ||
| - | [[Image:RO1final.jpg|center|RO1 final plot]] | + | [[Image:RO1final.jpg|center|thumb|upright=4|RO1 final plot]] |
| - | We can say that Read Out 1 is characterized, it shows exactly the answer we would expect. | + | We can say that Read Out 1 is characterized, it shows exactly the answer we would expect : if we add TRP, there is a significant decrease in RFP expression. |
==People in the lab== | ==People in the lab== | ||
| Line 68: | Line 68: | ||
<html><center><a href="https://2009.igem.org/EPF-Lausanne/10_September_2009"><img src="https://static.igem.org/mediawiki/2009/thumb/6/61/Flèche_gauche.png/70px-Flèche_gauche.png"></a> | <html><center><a href="https://2009.igem.org/EPF-Lausanne/10_September_2009"><img src="https://static.igem.org/mediawiki/2009/thumb/6/61/Flèche_gauche.png/70px-Flèche_gauche.png"></a> | ||
| - | <a href="https://2009.igem.org/EPF-Lausanne/ | + | <a href="https://2009.igem.org/EPF-Lausanne/17_September_2009"><img src="https://static.igem.org/mediawiki/2009/thumb/5/5e/Fleche_droite.png/70px-Fleche_droite.png"></a></center></html> |
</div><div CLASS="epfl09bouchon"></div> | </div><div CLASS="epfl09bouchon"></div> | ||
Latest revision as of 12:48, 4 October 2009
Contents |
Wet Lab
O.D. for the Trp K.O. strains
For the competent cells !
After 5p.m. :
JRG1046 : 1.35. JRG465 : 0.85. JW4356-2 : 1.64. JW4356-2 (Kana) : 1.57.
For today we drop the experiment, we are too far from 0.6. We will do it on Monday.
Results of the characterization
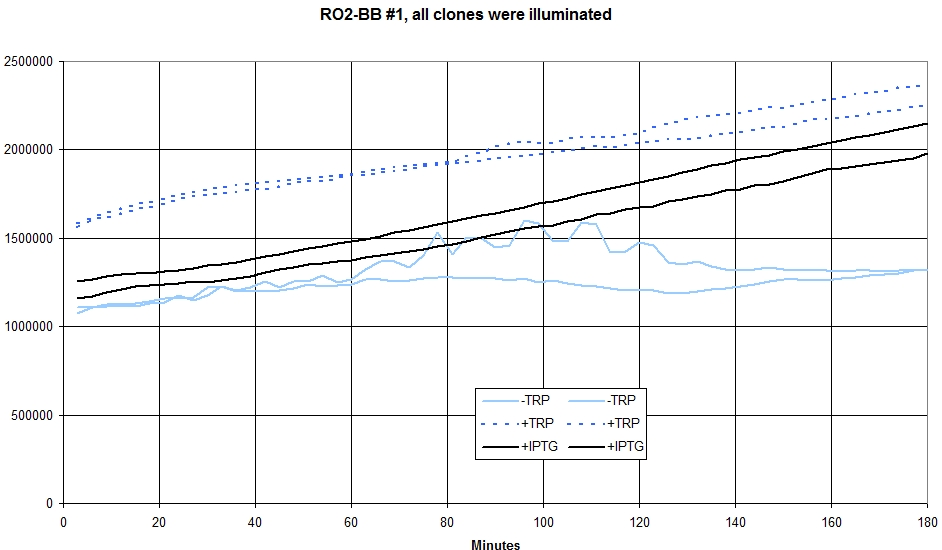
RO2-BB #1, all clones were illuminated :
We have induction (repression repressed...) from LovTAP, we have to investigate further to be sure it is what we want.
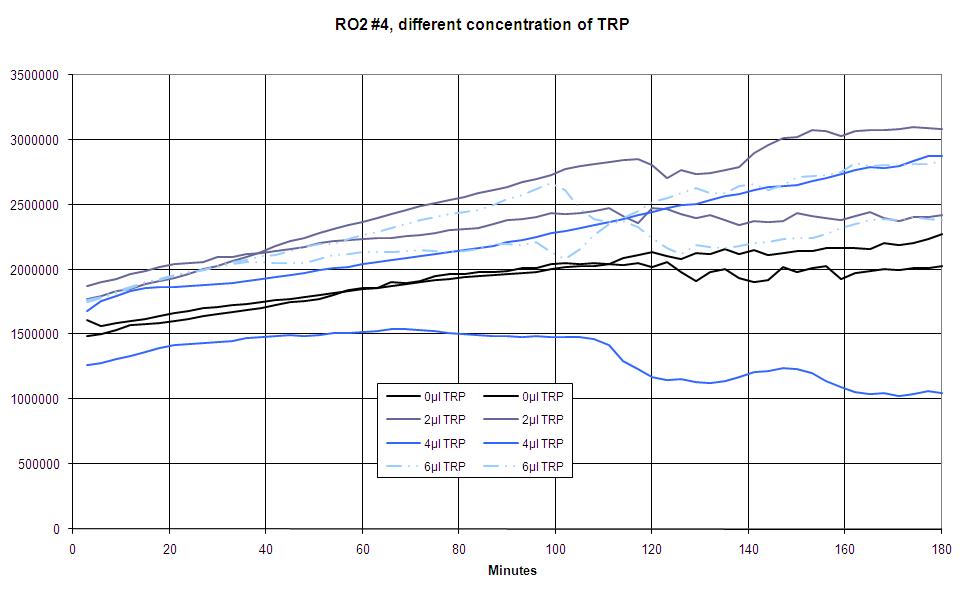
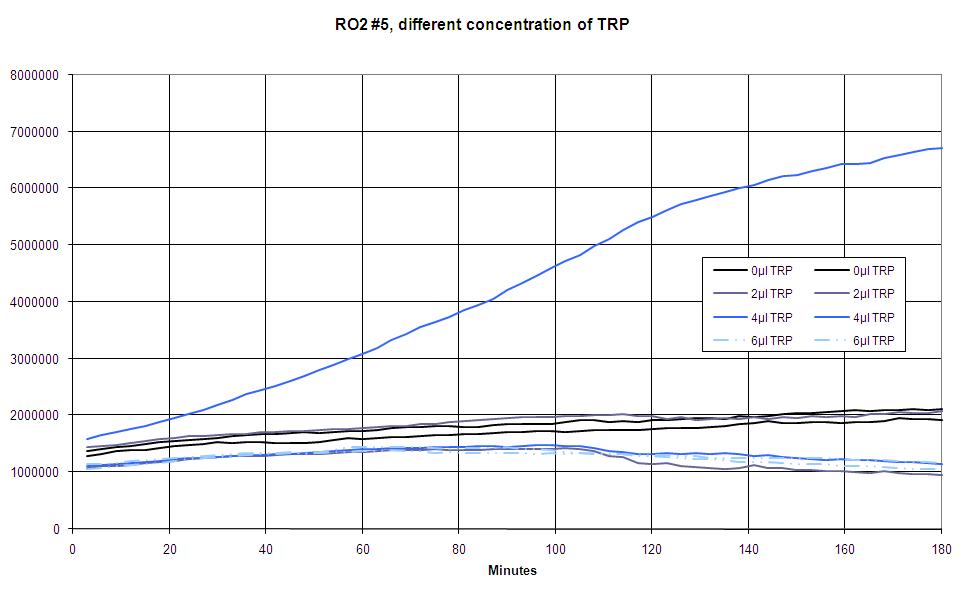
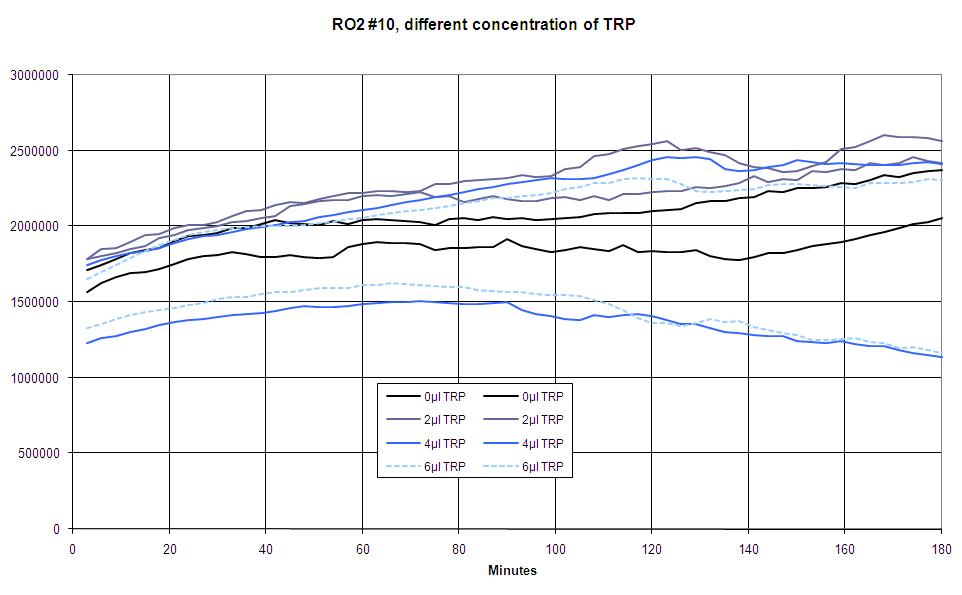
Tryptophan concentration experiment on RO2 :
All the clones react in the same way, here it is the graph for RO2#4. It seems we have an increase until somewhere between 2ul and 4 ul (in 50 ul of culture, TRP : 4.25 g/L).
RO2#5
RO2#10
RO1-BB didn't respond.
RO2#4, influence of TRP and ATC
Nicolas ce graph n'est pas dans ce que tu nous a envoyé, est-ce que tu peux le rajouter stp ???
Read out 1 characterization
To summarize our results, we did the following graphic :
We can say that Read Out 1 is characterized, it shows exactly the answer we would expect : if we add TRP, there is a significant decrease in RFP expression.
People in the lab
Mélanie, Caroline, Basile, Nicolas


 "
"

