Team:MoWestern Davidson/project mathmodel
From 2009.igem.org
(→Square Diagrams) |
|||
| (57 intermediate revisions not shown) | |||
| Line 7: | Line 7: | ||
The clauses of 2-SAT problems can be graphed as squares on a grid, like the one below, forming a "B2 bomber" shape. The following grid shows all of the 4-variable 2-SAT problems. For example, the square completely to the bottom left corresponds to the clause (a' OR b). | The clauses of 2-SAT problems can be graphed as squares on a grid, like the one below, forming a "B2 bomber" shape. The following grid shows all of the 4-variable 2-SAT problems. For example, the square completely to the bottom left corresponds to the clause (a' OR b). | ||
| - | <center>[[Image: | + | <center>[[Image:Neutralsquare.png]]</center> |
| - | We used this grid to examine the geometric properties of unsatisfiable 2-SAT problems. Consider the following grid, which displays an unsatisfiable 2-SAT problem. The squares representing the clauses selected for the problem have been colored black. This particular problem is (a OR b) AND (a OR b') AND (a' OR b) AND (a' OR b').<center>[[Image: | + | We used this grid to examine the geometric properties of unsatisfiable 2-SAT problems. Consider the following grid, which displays an unsatisfiable 2-SAT problem. The squares representing the clauses selected for the problem have been colored black. This particular problem is (a OR b) AND (a OR b') AND (a' OR b) AND (a' OR b'). |
| + | |||
| + | <center>[[Image:Selectsquare.png]]</center> | ||
This problem is unsatisfiable because choosing both literals of one of the variables present is required to solve the problem. For example, the input (a, b, c, d) satisfies the first three clauses but fails to satisfy the fourth because both a and a' or both b and b' cannot be in an input together. | This problem is unsatisfiable because choosing both literals of one of the variables present is required to solve the problem. For example, the input (a, b, c, d) satisfies the first three clauses but fails to satisfy the fourth because both a and a' or both b and b' cannot be in an input together. | ||
| - | <html><center><embed src="https://static.igem.org/mediawiki/2009/ | + | |
| + | The following animation displays the unsatisfiable 2-SAT problems with four clauses. The blackened squares represent the clauses selected for each problem. | ||
| + | |||
| + | <html><center><embed src="https://static.igem.org/mediawiki/2009/7/77/Prog.mov"quality=best HEIGHT=500 WIDTH=600></center></html> | ||
| + | |||
| + | With the aid of this animation, we made the following conjecture about the nature of unsatisfiable 2-SAT problems: An unsatisfiable n-variable 2-SAT problem with c clauses contains at most c - 1 variables (c > 3), all of which must be in conflict with each other, and there must be at least two conflicts. A '''conflict''' occurs when a group of clauses contains both literals of a variable. When both literals of a conflicted variable are not paired with the same variable, the conflict is said to be '''separated'''. | ||
| + | |||
| + | For example, consider the problem (a OR b) AND (a OR b') AND (a' OR b) AND (a' OR b'). This problem has two conflicts because it contains both a literals and both b literals. But the problem (a OR b) AND (a OR b') AND (a' OR c) AND (a' OR c') has three conflicts because it contains both literals of three variables. Note also that the a-conflict is separated; the literal a is paired with the variable b, whereas the literal a' is paired with the variable c. | ||
==Block Diagrams== | ==Block Diagrams== | ||
| Line 20: | Line 29: | ||
Just as the 2-SAT clauses can be graphed as squares, the 3-SAT clauses can be graphed as blocks. The following right-handed coordinate system displays all of the 3-variable 3-SAT problems. | Just as the 2-SAT clauses can be graphed as squares, the 3-SAT clauses can be graphed as blocks. The following right-handed coordinate system displays all of the 3-variable 3-SAT problems. | ||
| - | <center>[[Image: | + | <center>[[Image:Miguel.png]]</center> |
| - | The x- and y-axes are labeled just as they were in the square diagrams, with one difference. If there are n variables in a given 3-SAT scenario to be visualized, there will be n - 1 variables on the x- and y- axes. So, for this scenario, which has three variables, the x-axis is scaled a', a, b', b, and the y-axis is scaled a, a', b, b'. The z-axis always has the remaining variables, starting from the negative of the last variable at the bottom and ending with c at the top. Therefore, the z-axis in this scenario is scaled c', c. As another example, if there were four variables in a 3-SAT scenario, then the x-axis would be scaled a', a, b', b, c', c | + | The x- and y-axes are labeled just as they were in the square diagrams, with one difference. If there are n variables in a given 3-SAT scenario to be visualized, there will be n - 1 variables on the x- and y-axes. So, for this scenario, which has three variables, the x-axis is scaled a', a, b', b, and the y-axis is scaled a, a', b, b'. The z-axis always has the remaining variables, starting from the negative of the last variable at the bottom and ending with c at the top. Therefore, the z-axis in this scenario is scaled c', c. As another example, if there were four variables in a 3-SAT scenario, then the x-axis would be scaled a', a, b', b, c', c; the y-axis would be scaled a, a', b, b', c, c'; and the z-axis would be scaled d', d, c', c. |
| - | + | With Mathematica commands we highlighted all of the clauses not satisfied by a particular input. For example, consider the input (a, b, c). The 3-SAT clause that this input cannot satisfy is (a' OR b' OR c'), which is represented by the block on the bottom right of the right "wing." The diagram on the left below shows how this block is highlighted red to show that it is not satisfied by the input applied. The diagram on the right below shows that the clause (a' OR b OR c') is not satisfied by the input (a, b', c). | |
| - | + | <center>[[Image:Highlight.png]][[Image:Maya.png]]</center> | |
| + | The following animation shows how the number of 3-SAT clauses not satisfied by the input in which all variables are true changes as the number of variables changes from three to eight. | ||
| + | <html><center><embed src="https://static.igem.org/mediawiki/2009/c/ce/Blocks3.mov"quality=best HEIGHT=500 WIDTH=600></center></html> | ||
| - | To classify SAT problems, we began looking at the | + | A graphical representation like this helps show very concretely how the number of 3-SAT clauses grows in addition to providing a way to keep track of all 3-SAT clauses. Furthermore, these graphs demonstrate inputs geometrically as planes that intersect the blocks, with the blocks not touched by the planes (the unsatisfied clauses) highlighted red. |
| + | |||
| + | ==Rough and Fine Distributions== | ||
| + | |||
| + | === Rough Distributions === | ||
| + | |||
| + | To classify SAT problems, we began looking at the rough distribution of each problem, meaning how many inputs satisfied a certain number of clauses in a problem. There are <sub>3</sub>C<sub>2</sub> × 2<sup>2</sup> = 12 clauses for 3-variable 2-SAT. There are <sub>12</sub>C<sub>3</sub> = 220 problems with 3 clauses. The table below gives the number of clauses satisfied by each input for a few select 2-SAT problems. | ||
<center>[[Image:Tablecool.png|none|750px|]]</center> | <center>[[Image:Tablecool.png|none|750px|]]</center> | ||
| Line 42: | Line 59: | ||
<center>[[Image:Superspecialawesome.png|none|750px]]</center> | <center>[[Image:Superspecialawesome.png|none|750px]]</center> | ||
| - | + | Rough distributions help us find a reasonable problem to attempt from a biological perspective, as the biology side is limited by the low suppression rate of the tRNAs. The 0143 distribution class is a suitable one from which to choose problems because there are inputs for this class which solve one, two, and three clauses in a problem. This is helpful in a MAX-SAT setting, in which we try to determine the maximum number of clauses satisfied. Since this class has a reasonably high number of inputs that solve one or two clauses in a problem, we can set up biological scenarios in which fewer than all of the clauses have to be satisfied for a reporter to be expressed. | |
| - | + | === Fine Distributions === | |
| + | Fine distributions look more deeply at how each clause was satisfied. If an input satisfies one or two literals in a clause, that clause is satisfied '''singly''' or '''doubly''' respectively. For example, the input abc’ satisfies the clause (a OR b’) singly because it satisfies only one literal in the clause. However, the same input abc’ satisfies the clause (b OR c’) doubly because it satisfies two literals in the clause. | ||
| - | + | The fine distribution for the red problem from the table above is '''0011212100'''. This distribution means that: <br> | |
| - | + | *'''0''' inputs satisfied 0 clauses<br> | |
| - | + | *'''0''' inputs satisfied 1 clause singly<br> | |
| - | + | *'''1''' input satisfied 1 clause doubly<br> | |
| - | + | *'''1''' input satisfied 2 clauses with 2 singles<br> | |
| - | + | *'''2''' inputs satisfied 2 clauses with 1 single and 1 double<br> | |
| - | The fine distribution for the red problem from the table above is '''0011212100'''. This distribution means that 0 inputs satisfied 0 clauses | + | *'''1''' input satisfied 2 clauses with 2 doubles<br> |
| - | + | *'''2''' inputs satisfied 3 clauses with 3 singles<br> | |
| - | The following pie chart shows 2-SAT, 3-clause problems grouped by fine distribution, with each shade of a given color representing one fine distribution | + | *'''1''' input satisfied 3 clauses with 2 singles and 1 double<br> |
| + | *'''0''' inputs satisfied 3 clauses with 1 single and 2 doubles, and <br> | ||
| + | *'''0''' inputs satisfied 3 clauses with 3 doubles.<br> | ||
| + | <br> | ||
| + | The following pie chart shows 2-SAT, 3-clause problems grouped by fine distribution, with each shade of a given color representing one fine distribution: | ||
<center>[[Image:Picture5.png|none|750px]]</center> | <center>[[Image:Picture5.png|none|750px]]</center> | ||
| - | + | Fine distributions further narrow the choice of problem within a particular rough distribution. For instance, if a clause in a particular problem is solved doubly by a particular input, then that corresponds to two suppressor tRNAs binding to 5mer sequences in the clause. This is more favorable biologically as it would mean that there is a greater chance for suppression to occur and the reporter to be expressed. | |
{{Template:MoWestern_Davidson2009_end}} | {{Template:MoWestern_Davidson2009_end}} | ||
Latest revision as of 15:32, 20 October 2009

Contents |
Square Diagrams
We used Wolfram Mathematica to visualize 2-SAT problems and particularly to analyze unsatisfiable problems with varying numbers of clauses.
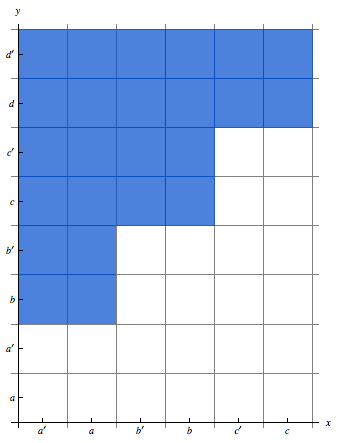
The clauses of 2-SAT problems can be graphed as squares on a grid, like the one below, forming a "B2 bomber" shape. The following grid shows all of the 4-variable 2-SAT problems. For example, the square completely to the bottom left corresponds to the clause (a' OR b).
We used this grid to examine the geometric properties of unsatisfiable 2-SAT problems. Consider the following grid, which displays an unsatisfiable 2-SAT problem. The squares representing the clauses selected for the problem have been colored black. This particular problem is (a OR b) AND (a OR b') AND (a' OR b) AND (a' OR b').
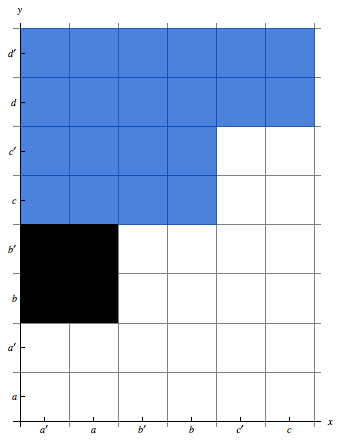
This problem is unsatisfiable because choosing both literals of one of the variables present is required to solve the problem. For example, the input (a, b, c, d) satisfies the first three clauses but fails to satisfy the fourth because both a and a' or both b and b' cannot be in an input together.
The following animation displays the unsatisfiable 2-SAT problems with four clauses. The blackened squares represent the clauses selected for each problem.
With the aid of this animation, we made the following conjecture about the nature of unsatisfiable 2-SAT problems: An unsatisfiable n-variable 2-SAT problem with c clauses contains at most c - 1 variables (c > 3), all of which must be in conflict with each other, and there must be at least two conflicts. A conflict occurs when a group of clauses contains both literals of a variable. When both literals of a conflicted variable are not paired with the same variable, the conflict is said to be separated.
For example, consider the problem (a OR b) AND (a OR b') AND (a' OR b) AND (a' OR b'). This problem has two conflicts because it contains both a literals and both b literals. But the problem (a OR b) AND (a OR b') AND (a' OR c) AND (a' OR c') has three conflicts because it contains both literals of three variables. Note also that the a-conflict is separated; the literal a is paired with the variable b, whereas the literal a' is paired with the variable c.
Block Diagrams
We used Mathematica to construct block diagrams in order to visualize 3-SAT, as well as to graphically represent the clauses not satisfied by a particular input.
Just as the 2-SAT clauses can be graphed as squares, the 3-SAT clauses can be graphed as blocks. The following right-handed coordinate system displays all of the 3-variable 3-SAT problems.
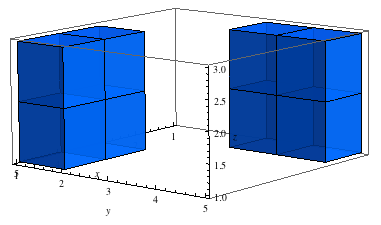
The x- and y-axes are labeled just as they were in the square diagrams, with one difference. If there are n variables in a given 3-SAT scenario to be visualized, there will be n - 1 variables on the x- and y-axes. So, for this scenario, which has three variables, the x-axis is scaled a', a, b', b, and the y-axis is scaled a, a', b, b'. The z-axis always has the remaining variables, starting from the negative of the last variable at the bottom and ending with c at the top. Therefore, the z-axis in this scenario is scaled c', c. As another example, if there were four variables in a 3-SAT scenario, then the x-axis would be scaled a', a, b', b, c', c; the y-axis would be scaled a, a', b, b', c, c'; and the z-axis would be scaled d', d, c', c.
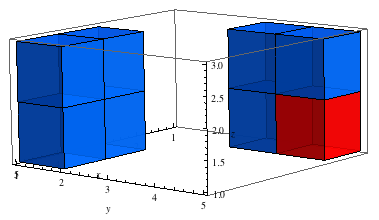
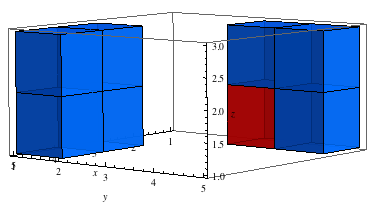
With Mathematica commands we highlighted all of the clauses not satisfied by a particular input. For example, consider the input (a, b, c). The 3-SAT clause that this input cannot satisfy is (a' OR b' OR c'), which is represented by the block on the bottom right of the right "wing." The diagram on the left below shows how this block is highlighted red to show that it is not satisfied by the input applied. The diagram on the right below shows that the clause (a' OR b OR c') is not satisfied by the input (a, b', c).
The following animation shows how the number of 3-SAT clauses not satisfied by the input in which all variables are true changes as the number of variables changes from three to eight.
A graphical representation like this helps show very concretely how the number of 3-SAT clauses grows in addition to providing a way to keep track of all 3-SAT clauses. Furthermore, these graphs demonstrate inputs geometrically as planes that intersect the blocks, with the blocks not touched by the planes (the unsatisfied clauses) highlighted red.
Rough and Fine Distributions
Rough Distributions
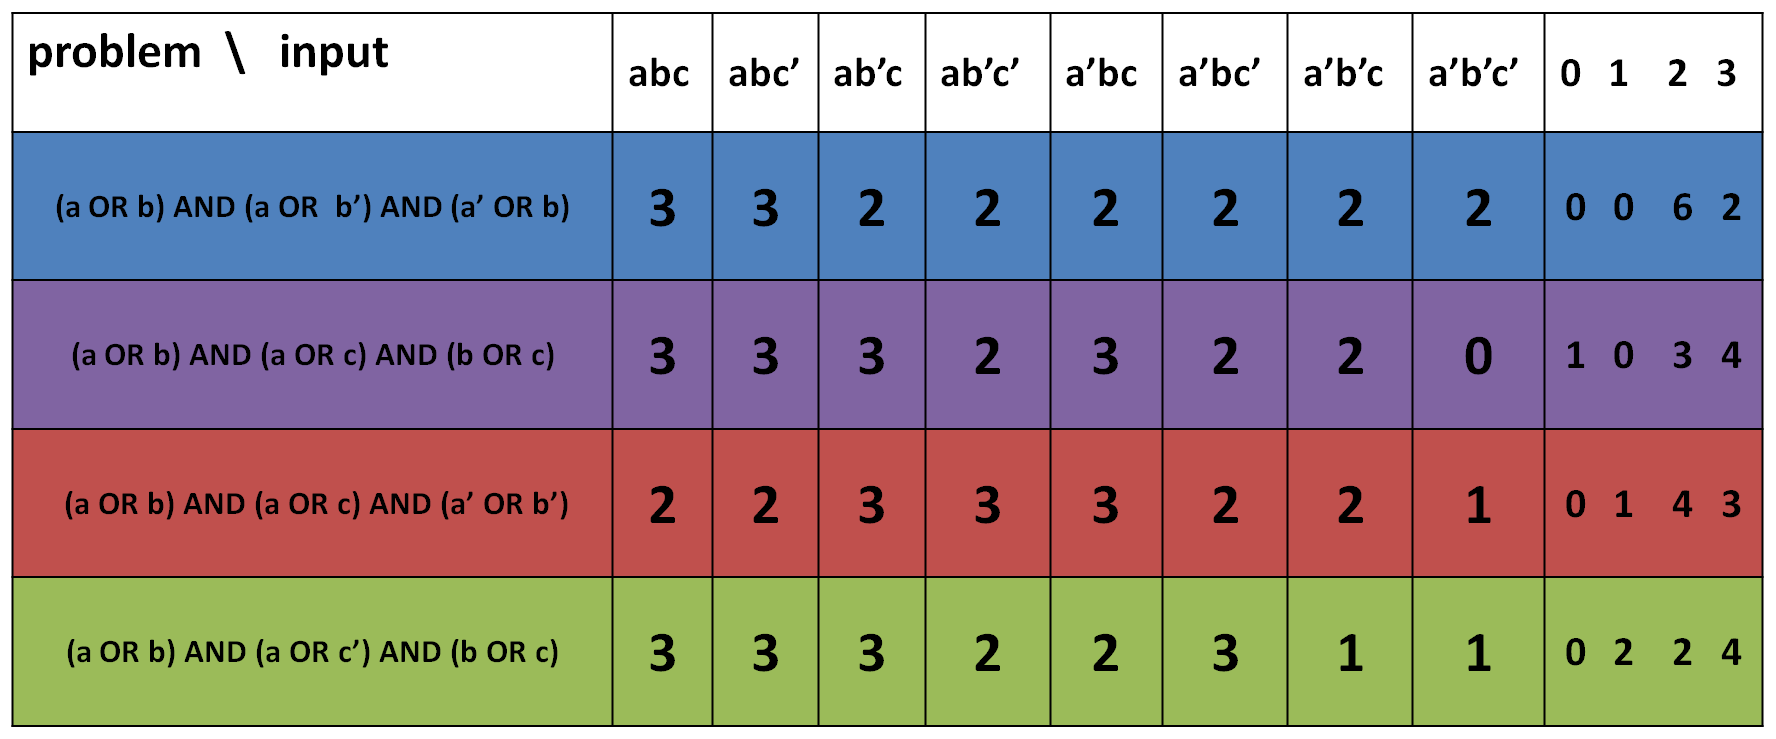
To classify SAT problems, we began looking at the rough distribution of each problem, meaning how many inputs satisfied a certain number of clauses in a problem. There are 3C2 × 22 = 12 clauses for 3-variable 2-SAT. There are 12C3 = 220 problems with 3 clauses. The table below gives the number of clauses satisfied by each input for a few select 2-SAT problems.
The rough distribution for the red problem is 0143. That distribution means 0 inputs satisfied 0 clauses, 1 input satisfied 1 clause, 4 inputs satisfied 2 clauses and 3 inputs satisfied all 3 clauses.
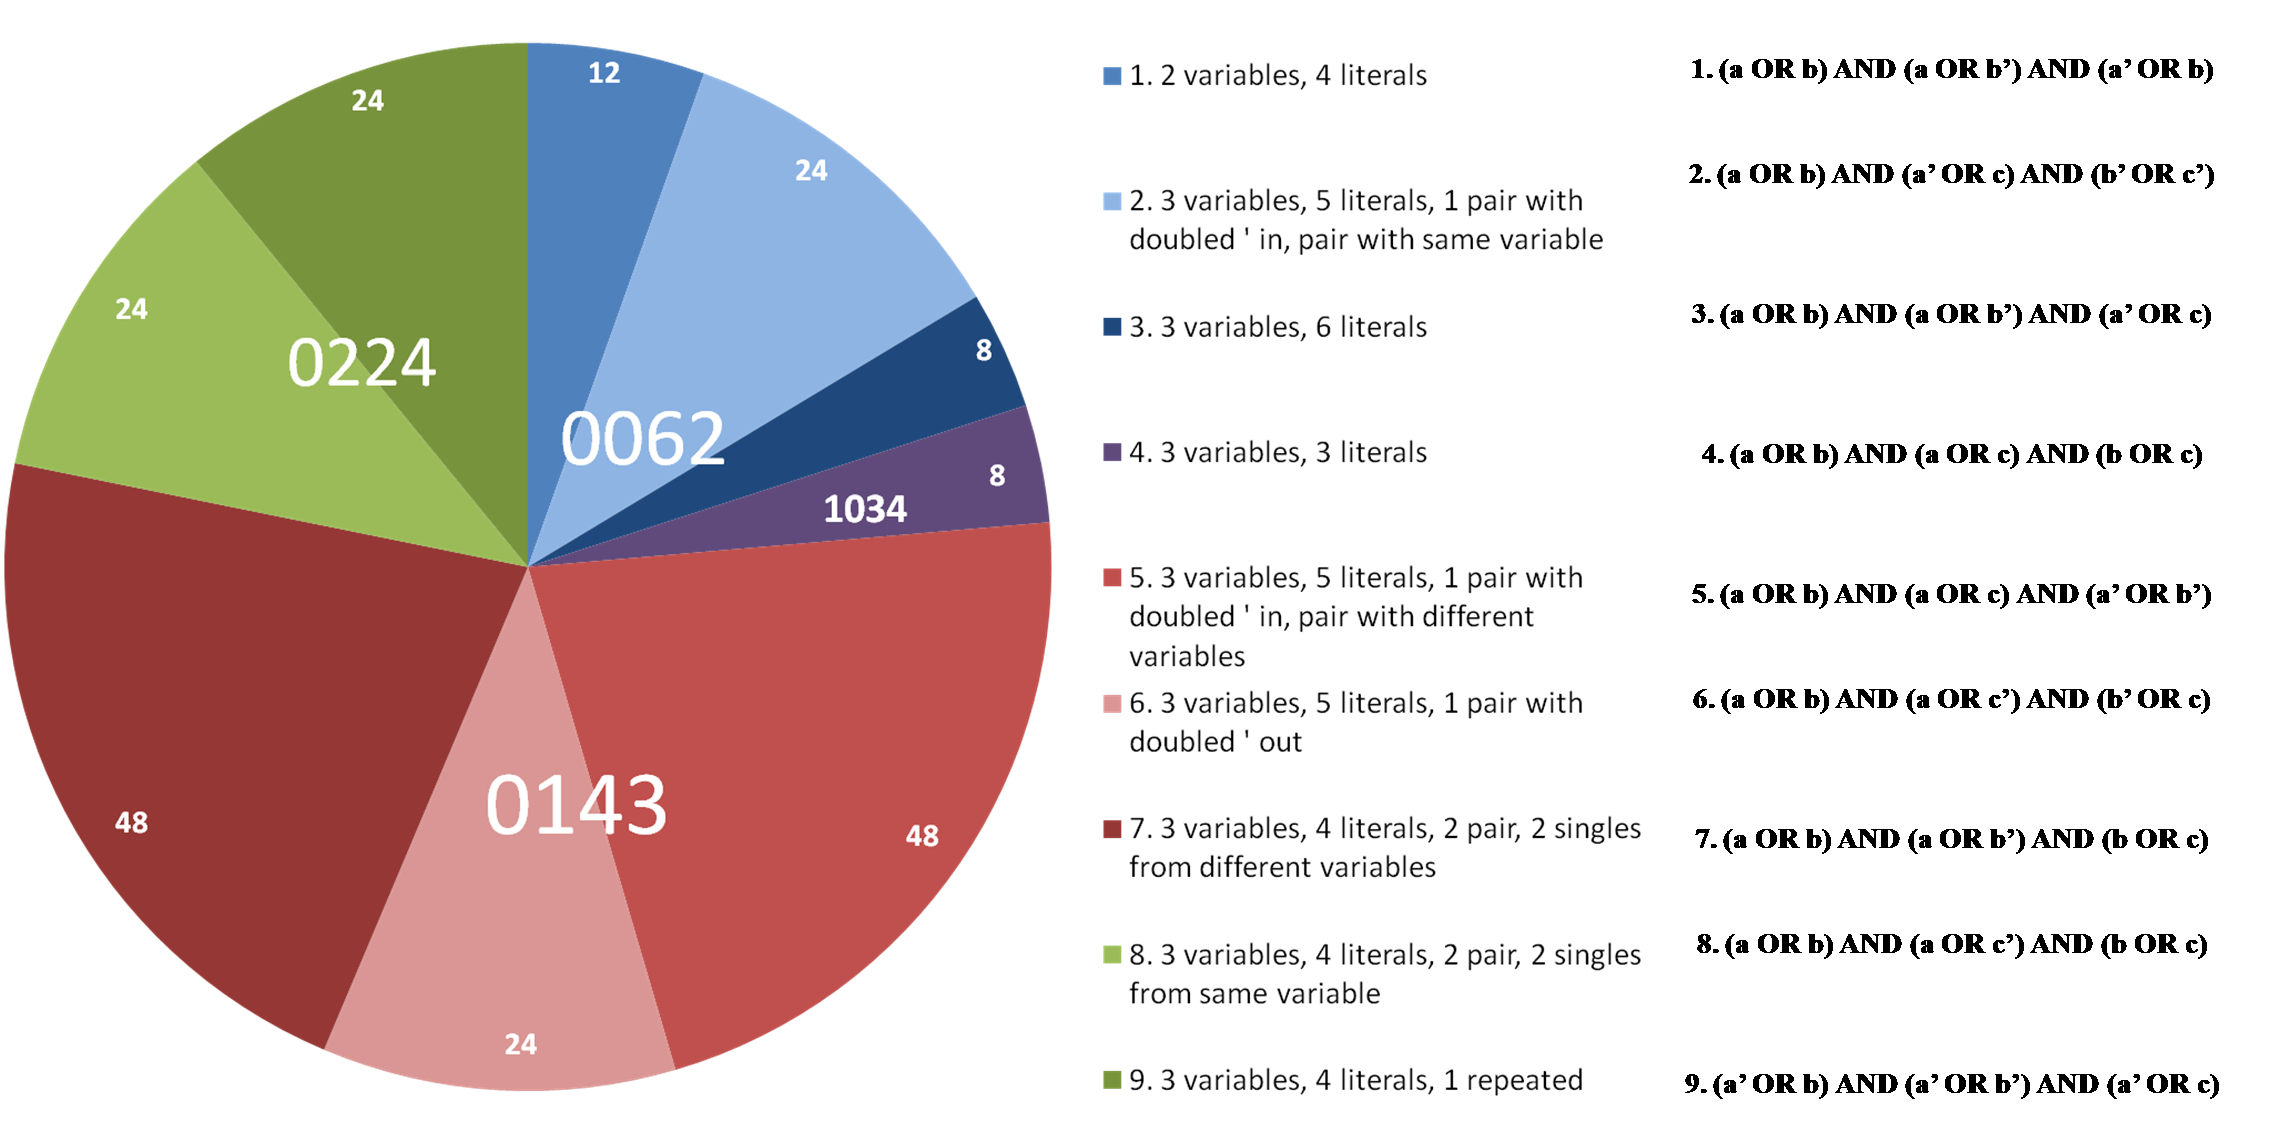
The following pie chart shows 2-SAT 3-clause problems grouped by rough distribution, with all shades of a given color representing one rough distribution.
Rough distributions help us find a reasonable problem to attempt from a biological perspective, as the biology side is limited by the low suppression rate of the tRNAs. The 0143 distribution class is a suitable one from which to choose problems because there are inputs for this class which solve one, two, and three clauses in a problem. This is helpful in a MAX-SAT setting, in which we try to determine the maximum number of clauses satisfied. Since this class has a reasonably high number of inputs that solve one or two clauses in a problem, we can set up biological scenarios in which fewer than all of the clauses have to be satisfied for a reporter to be expressed.
Fine Distributions
Fine distributions look more deeply at how each clause was satisfied. If an input satisfies one or two literals in a clause, that clause is satisfied singly or doubly respectively. For example, the input abc’ satisfies the clause (a OR b’) singly because it satisfies only one literal in the clause. However, the same input abc’ satisfies the clause (b OR c’) doubly because it satisfies two literals in the clause.
The fine distribution for the red problem from the table above is 0011212100. This distribution means that:
- 0 inputs satisfied 0 clauses
- 0 inputs satisfied 1 clause singly
- 1 input satisfied 1 clause doubly
- 1 input satisfied 2 clauses with 2 singles
- 2 inputs satisfied 2 clauses with 1 single and 1 double
- 1 input satisfied 2 clauses with 2 doubles
- 2 inputs satisfied 3 clauses with 3 singles
- 1 input satisfied 3 clauses with 2 singles and 1 double
- 0 inputs satisfied 3 clauses with 1 single and 2 doubles, and
- 0 inputs satisfied 3 clauses with 3 doubles.
The following pie chart shows 2-SAT, 3-clause problems grouped by fine distribution, with each shade of a given color representing one fine distribution:
Fine distributions further narrow the choice of problem within a particular rough distribution. For instance, if a clause in a particular problem is solved doubly by a particular input, then that corresponds to two suppressor tRNAs binding to 5mer sequences in the clause. This is more favorable biologically as it would mean that there is a greater chance for suppression to occur and the reporter to be expressed.
 "
"
