Team:Paris/Production modeling
From 2009.igem.org
Christophe.R (Talk | contribs) (→"The Delay system") |
(→Genetic Network Regulation) |
||
| Line 27: | Line 27: | ||
| - | As it is crucial to send vesicules only when the concentration of proteins to be sent is at its maximum level in the periplasm. To increase the power of our communication system, we | + | As it is crucial to send vesicules only when the concentration of proteins to be sent is at its maximum level in the periplasm. To increase the power of our communication system, we tried to make this peak of vesicules creation correspond with the peak of protein concentration. |
We had two hypothesis which led us to think over two different genetic regulatory network : | We had two hypothesis which led us to think over two different genetic regulatory network : | ||
| - | + | ||
| - | + | ||
*first the number of vesicules produced is at its maximum when the concentration of TolRII has reached its peak ; this achieve this configuration, we tried to design a delay system based on a transcriptional cascade as described in the part “The delay sytem”. | *first the number of vesicules produced is at its maximum when the concentration of TolRII has reached its peak ; this achieve this configuration, we tried to design a delay system based on a transcriptional cascade as described in the part “The delay sytem”. | ||
| Line 132: | Line 131: | ||
| - | + | The initial quantities were used for simulation : | |
| + | *4000 units of TetR (steady state level at inactivation) | ||
| + | *No LacI nor Protein nor TolRII | ||
| + | |||
| + | We got the following dynamics using Matlab software : | ||
| + | |||
| + | |||
[[Image:Delay System.jpg|600px|center]] | [[Image:Delay System.jpg|600px|center]] | ||
Revision as of 18:03, 17 October 2009
iGEM > Paris > DryLab > Vesicle production Model (delay model)
Delay model est un mauvais titre du chapître.
Genetic Network Regulation
This part aimed at solving the first problem linked to the creation of messengers :
As it is crucial to send vesicules only when the concentration of proteins to be sent is at its maximum level in the periplasm. To increase the power of our communication system, we tried to make this peak of vesicules creation correspond with the peak of protein concentration.
We had two hypothesis which led us to think over two different genetic regulatory network :
- first the number of vesicules produced is at its maximum when the concentration of TolRII has reached its peak ; this achieve this configuration, we tried to design a delay system based on a transcriptional cascade as described in the part “The delay sytem”.
- then, we also made the hypothesis that the number of vesicules by time units would be more important when the production of TolRII by time units is at its maximum ; this would allow a more powerful signal provided a good concentration of proteins. That is what we tried to put into place thanks to the use of feed-forwards ; see here for more explanations.
"The Delay system"
The first thing that we wanted to study in modeling was the efficiency of the construction chosen to create a delay. Our first approach was a deterministic analysis of the system using differential equations. The regulation of promoters was described using the Hill functions and the methods described by U. Alon in his book An Introduction to Systems Biology .
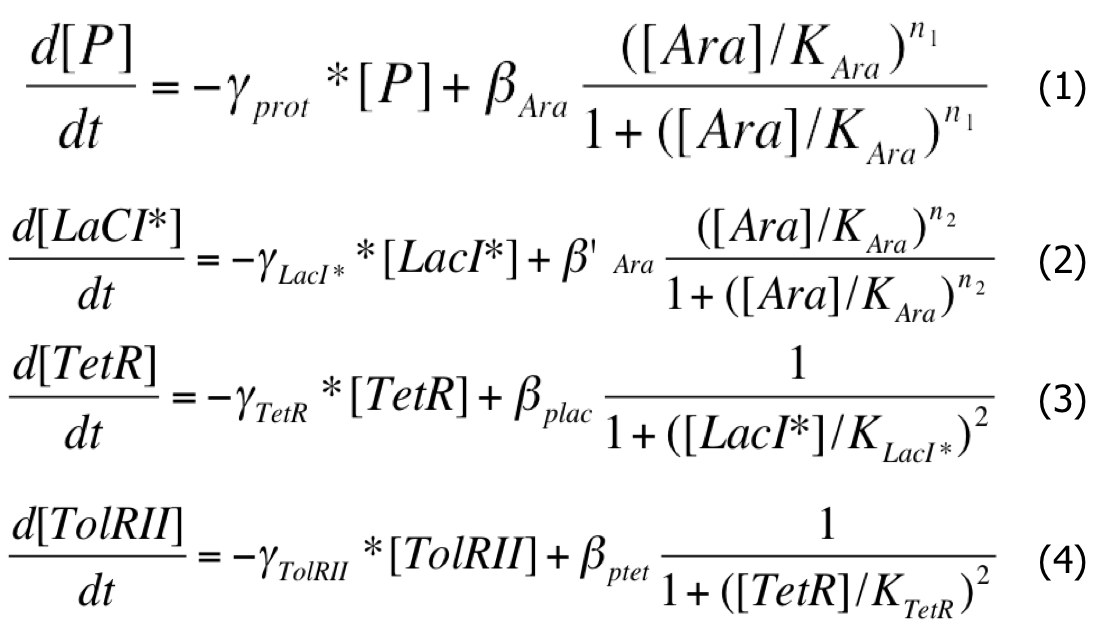
Redonner un schém de la partie correspondante ou renvoyer à un schéma ailleurs When the system is activate par quoi d, there is Arabinose in the medium and the pBad promoters are activated. And the system can be described by this system of differential equations :
| Differential System |
|
As a first approximation, we assumed that :
- When the pBad promoter is induced, the concentration of arabinose in the medium is very high and constant during he whole study ; as a consequence, we will consider that the creation rate of Protein and LacI* is constant during the experiment :
- We considered that all the binding constants are identical and of an average of 40nM which correspond to approximately 40 monomers per cell ; we can write that :
- We chose identical intrisinc promoter activities, β , all equal to 4000 proteins/cell cycle :
- All the time units were expressed in units of cell cycle (approximately half an hour) ; as a consequence we chose a dilution rate γ of 1 for protein without special tags. For the Laci protein with a LVA tag, the dilution rate is multiplied by 3:
The initial quantities were used for simulation :
- 4000 units of TetR (steady state level at inactivation)
- No LacI nor Protein nor TolRII
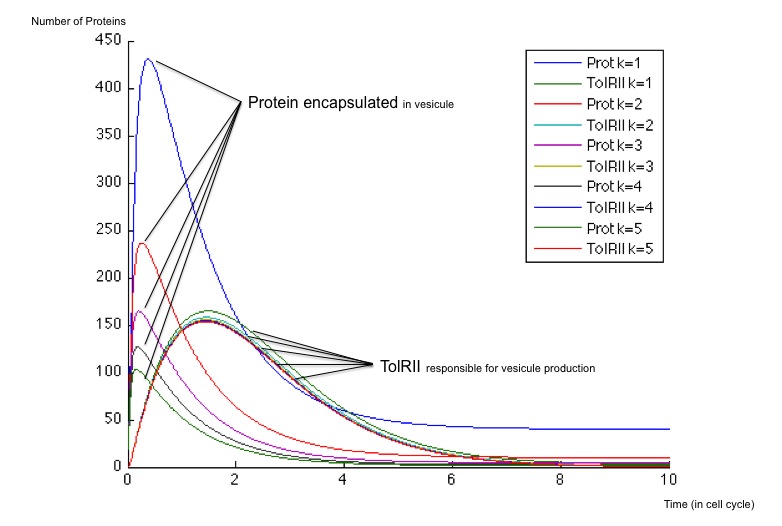
We got the following dynamics using Matlab software :
Titre de la figure et unités des axes
The Feedforwards
Using the delay system in our genetic regulatory network, we were able to find a way to get a maximum quantity of TolRII when the concentration of exported proteins is at its maximum. Expliquer
The previous system seems sufficient to tune maximum TolRII production with maximal vesicles production. However we examined another device to achieve the same goal... We also have thought of another device designed to have a reaction rate of TolRII production at its higher level when the concentration of exported is at its maximum. To this end, we decided to combine two feed-forward loops to create a "burst" in the production of each protein.
The Feed Forward Motif
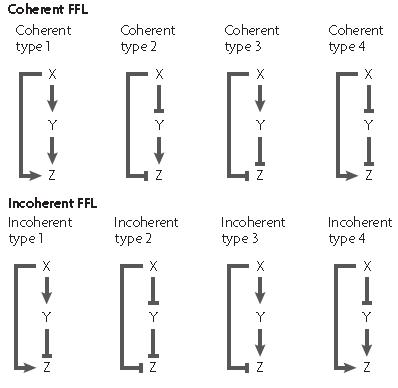
The feed forward motif was studied and described by U. Alon in his book "An Introduction to Synthetic Biology" where he describes the different form of existing feed forward ; they can be either coherent or incoherent.
In each case, there exist a different network organisation to create a feed-forward loop as shown on the picture
The X and Y inputs can be combined either using a logical AND or OR gate thus giving different dynamics properties in each case.
The coherent feed forward loop allow the creation of a delay either on activation or on desactivation depending on the logical function between the two input X and Y. When the output logical gate is an AND function, the delay appears on activation, while when the output gate is an OR function, the delay appears on desactivation. An example of caracterised feed-forward loop is the fliA system which was used by the 2008 Paris team in order to create a oscillator.
In an incoherent feed forward loop, the two inputs of the last gate function have two different logical levels; one molecule (molecule X for example) is an activator while the other molecule is a repressor of the promoter controlling the expression of the output.
This way, when the input signal is on, the expression of molecule X starts activating both the promoters controlling the expression of Y and Z ; transcription starts and the amount of Y and Z molecules increases. Nevertheless, when the concentration of Y has reached its repression threshold, repression starts and the concentration of Z molecule decrease to its steady state.
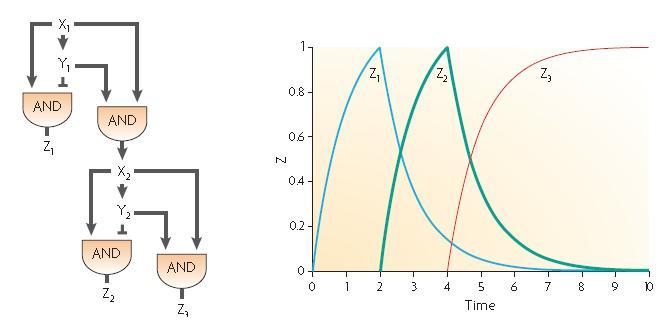
Two elementary incoherent feed forward motifs can be combined in order to create two time delayed bursts as described by U.Alon in its description of the development of Bacillus Subtilis spore. Anyway, it seems quite difficult to find a molecule which would be both an activator and a repressor ; we decided to try and think about another combination of these two feed forwards so as to get the dynamics we wanted as shown on the following part.
Our design proposition
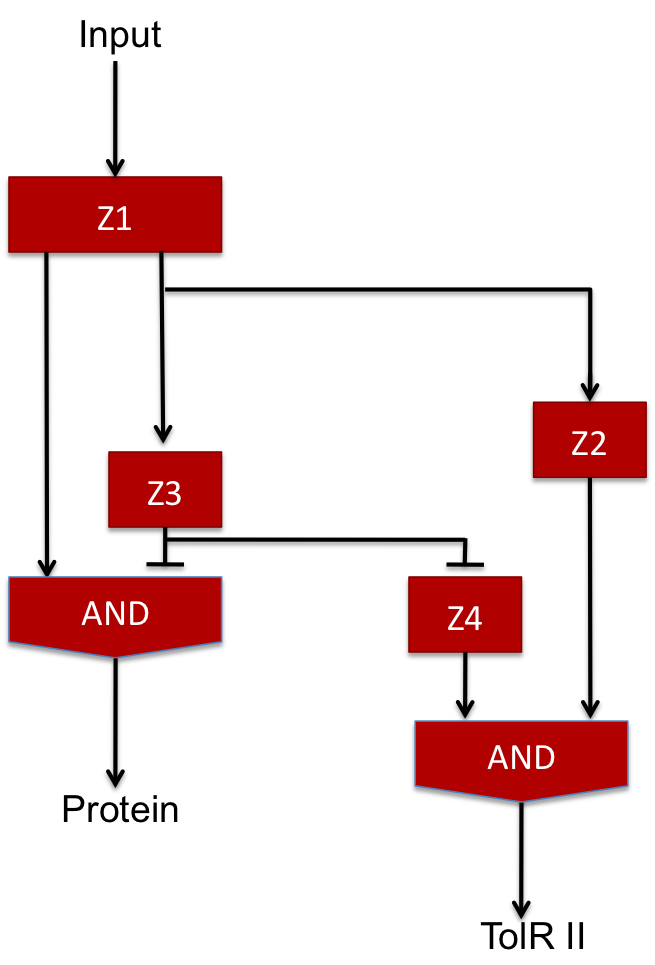
The two feed-forward loops used are incoherent and agenced in a way that each molecule is either an activator or a repressor (and not both). The following scheme gives the functionning of the system.
Manque Z4 dans le diagramme
| Steps | Description | Changes in concentration |
| 1 | When the input signal is ON, molecule1 is created and activates the promoter upstream the coding sequence for molecules Z2 and Z3 as well as Z4 since there is no molecule Z3 in the medium (see the AND gate function) at the beginning ; there is an initial amount of Z5 molecule but no Z2 so the no Z6 molecule is produced. | Z1 +++
Z2+ Z3+ Z4++ Z5~ Z6~ |
| 2 | After a while, there is enough Z3 to start the repression of Z4 promoter and there is also enough Z2 to start producing Z6 signficantly. | Z1+++
Z2+++ Z3+++ Z4- Z5~ Z6+ |
| 3 | Then, because of the repression of Z3, the Z4 molecule reaches its steady level ; in the same time, Z3 starts repressing the production of Z5 and the amount of Z6 starts decreasing. | Z1+
Z2+ Z3+ Z4~ Z5- Z6+ |
| 4 | Finally, Z3 repressesthe promoter allowing the creation of Z5 and every molecules reaches its steady level concentration. | Z1~
Z2~ Z3~ Z4~ Z5- Z6~ |
To study the dynamics of our model, we decided to use a classical approach using Michaelis-Menten equations to medel the activation and repression of the various promoters, including a cooperativity of order 2 for the repressor which often the case for 'classical' repressors such as LacI. We obtained the following system of equations :
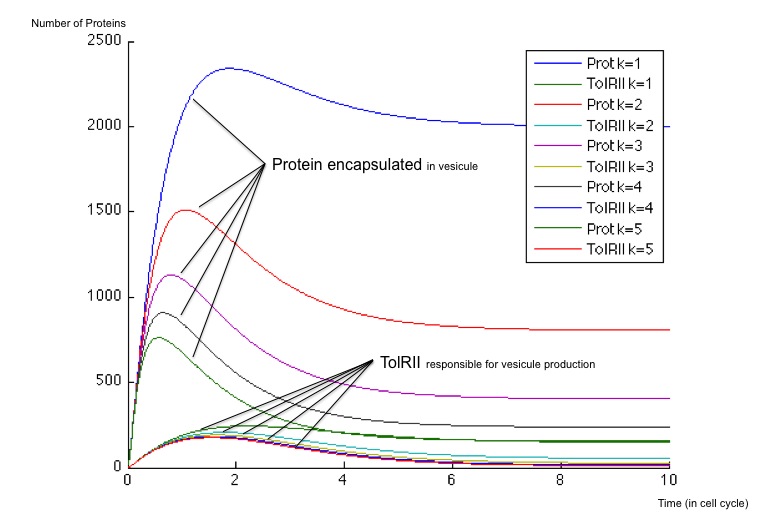
It is possible to obtain a important scale of values according to the choice of an optimized β for the production of molecule Z3 whose steady concentration and production rates impact on the steady state concentrations of the protein exported as well as the TolRII expressed. The β is chosen initially equal to 40 and 400 molecules by cell cycle and we have plotted the different response for multiples of this initial value.
Titre des graphes et légendes
A flexibility of Behaviour
Regardless of the steady state concentrations of the molecules, the use of two incohenrent feed forward loops allow a more important flexibility in the design of our system. With a simple delay system, we just get one possible dynamic behavior while using a variable range of production rates, we can obtain two behaviors :
- First, when the β is weak (β = 40), the number of TolRII produced slowly increase before returning to zero without another input signal of any kind ; on the other hand, the protein exported inside the vesicles is created very quickly and remains at a high concentration compared to the TolRII protein ; we can therefore send vesicles containing an important amount of interesting proteins and, after a while, stop expressing dangerous proteins for the cell. All of this can be performed with and single input signal.
- When the β is stronger, the behavior is different and we notice a change of concavity of the TolRII curve when the amount of protein exported is at its maximum. During such a change of concavity, the derivative reaches its maximum - in other words, the amount of TolRII produced by time units is at its highest level. Considering the hypothesis according to which the number of vesicules by time units would be more important when the production of TolRII by time units is at its maximum, we get a peak in vesicule production in this case.
- In any case, the number of TolRII proteins is less important than the amount of exported protein, thus protecting the cells from lysis.
 "
"


