Team:Lethbridge/Project
From 2009.igem.org
(→Results) |
(→Sequencing) |
||
| Line 1,452: | Line 1,452: | ||
</body> | </body> | ||
</html> | </html> | ||
| + | |||
| + | |||
| + | ===Overexpression=== | ||
Revision as of 03:01, 22 October 2009
- Home
- Team
- Project
- Ethics and Safety
- Notebook
- Meetings
- Modeling
- Parts
- Collaboration
- Judging
- Extra Information on SynBio
Project Details
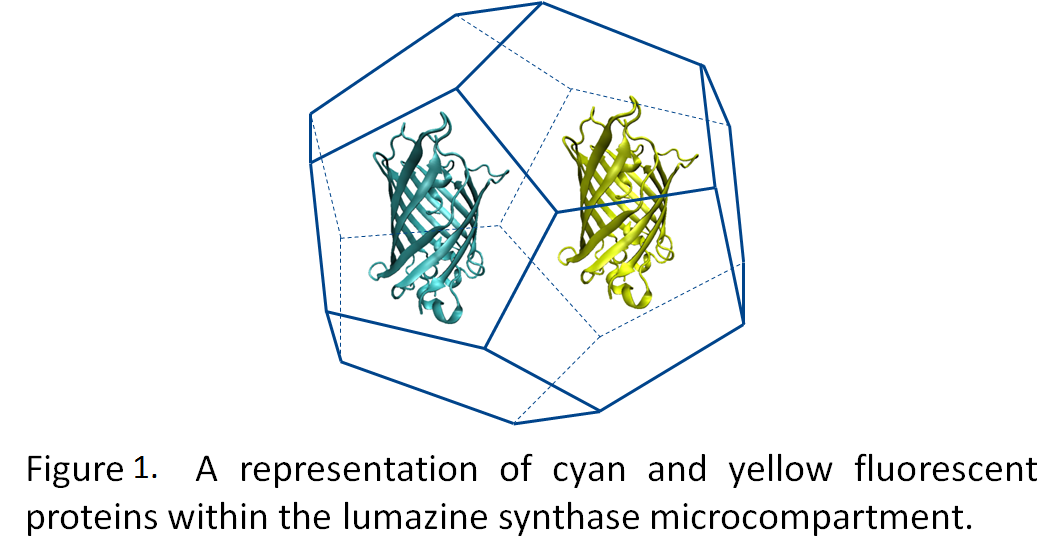
Many of the metabolic processes in eukaryotic cells are localized to various subcellular compartments. For example, transcription of mRNA from DNA is localized in the nucleus; post-translational modification and folding of proteins occurs in the endoplasmic reticulum (Voet et al., 2004). This essentially segregates and regulates these processes. However, bacteria lack distinct organelles, and as such, many metabolic processes intermingle. Engineering an artificial organelle, capable of containing metabolic proteins, in bacteria would thus represent a fundamental advance in biotechnology. Towards this end, the University of Lethbridge iGEM team is working towards producing microcompartments from the lumazine synthase gene, which forms 60 subunit icosahedral capsids (Seebeck et al., 2006).By generating a highly negative interior to the microcompartment, we hope to be able to target fluorescent proteins tagged with positively charged termini to the interior of the microcompartment (Figure 1). Utilizing fluorescence resonance energy transfer (FRET) between cyan and yellow fluorescent proteins, we will demonstrate the co-localization of these two proteins into the microcompartment.
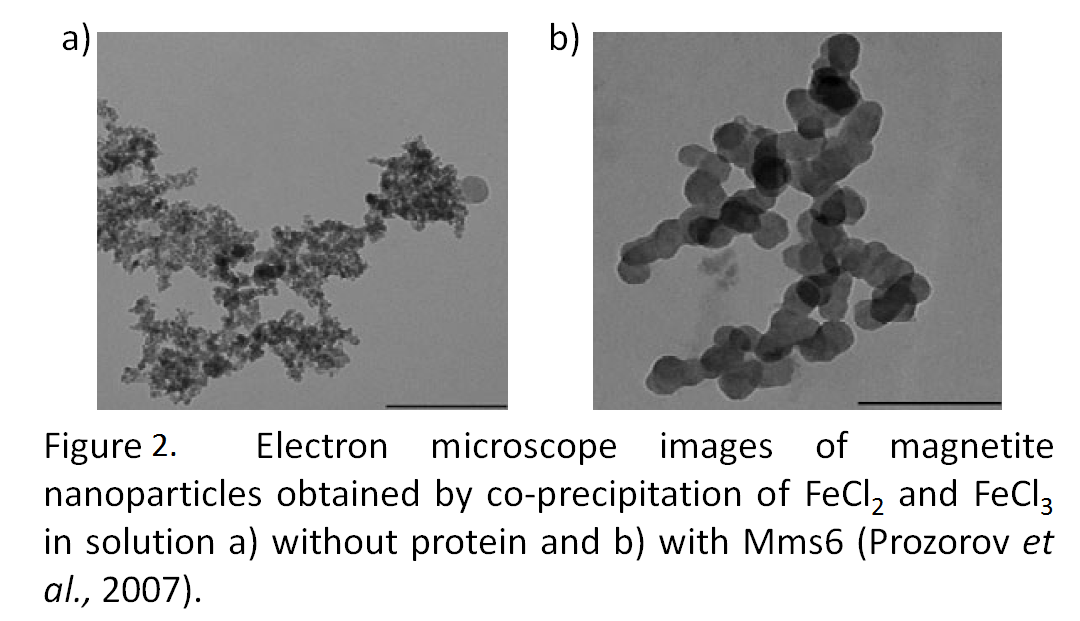
For the future application of this technology we are working towards the targeting of proteins from the photosynthetic pathway into the microcompartment to optimize a biological photosynthetic fuel cell. The segregation of proteins and metabolites increases the efficiency of cellular processes and following this theme, we are working towards creating uniform nanoparticles Through the segregation of Mms6 protein within Escherichia coli (Figure 2). (Prozorov et al., 2007).
We have also created a novel tool, the N and C terminus phusion vectors (BBa_K249004 and BBa_K249005) which will allow the targeting of any protein into the lumazine microcompartment. These vectors are an important highlight of the team's project, as they create a straightforward method for introducing the positively charged arginine tail onto any protein using standard biobrick assembly methods.
References
Prozorov, T., Mallapragada, S. K., Narasimhan, B., Wang, L., Palo, P., Nilsen-Hamilton, M., Williams, T. J., Bazylinski, D. A., Prozorov, R., and Canfield, P. C. (2007). Protein-mediated synthesis of uniform superparamagnetic magnetite nanocrystals. Adv. Funct. Mater. Advanced Functional Materials. 17, 951-957
Seebeck, F. P., Woycechowsky, K. J., Zhuang, W., Rabe, J. P., and Hilvert, D., (2006). A simple tagging system for protein encapulation. J. Am. Chem. Soc. 128, 4516-4517
Voet, D., and Voet, J.G., (2004). Biochemistry 3rd Edition. John Wiley & Sons, Inc.
The Experiments
Gene expression
The expression of a particular gene can be detected by measuring the amount of the protein product at different time points. The gene must be controlled in some sort of regulatory manner for expression to be calculable. The gene must be transformed into an expression cell strain, typically BL21 for E. coli. The cells are grown to an OD of 0.6. At this point the regulatory chemical is added to induce or repress the protein’s expression. Samples of the culture are taken at different time points. The cells are opened up and the contents are examined via some visualization technique, typically SDS-PAGE. We intend to view the expression of the following constructs in this manner.
- pLacI:sRBS:mms6:dT (induced with IPTG)
- pLacI:sRBS:Lumazine Synthase:dT (induced with IPTG)
- pStrong:Riboswitch:cheZ:dT (induced with Theophylline)
- pStrong:Riboswitch:GFP:dT (induced with Theophylline)
- pBAD:RBS:TetR:dT:pTetR:mRBS:N-EYFP:dT (repressed with Arabinose)
- pBAD:RBS:TetR:dT:pTetR:mRBS:C-EYFP:dT (repressed with Arabinose)
- pBAD:RBS:TetR:dT:pTetR:mRBS:N-ECFP:dT (repressed with Arabinose)
- pBAD:RBS:TetR:dT:pTetR:mRBS:C-ECFP:dT (repressed with Arabinose)
For the repressible constructs, as the repression of a protein is far more difficult to detect than the overexpression of a protein we intend to use fluorescence as our measurable, since in each case the protein which is repressed is a fluorescent protein. This is done in the same manner, as the expression, with samples of the culture being taken at different time points. Since we are unsure whether the intrinsic fluorescence of the cell will interfere with our measurements, we will measure the fluorescence of samples where the cells have been opened, as well as samples where they have not been opened (taken from the same culture, at the same time point). By measuring the change in fluorescence of the cells (or cell lysate) we can measure the effect of repression on the gene.
Motility Assay
The pStrong:Riboswitch:cheZ:dT construct is designed as a regulated motility construct. This gene has been designed to introduce regulated motility, to our motility knockout strain of E. coli, RP1616. In order to determine the mobility of our bacteria, we will qualitatively measure the apparent mobility of our bug in the absence and the presence of different concentrations of theophylline. We intend to do this in several different ways.
The first of which is simply a motility test. We will stab some of our bacteria into a motility media, in order to determine whether or not our bacteria are motile. A control of regular DH5a cells will be used as well.
The second is to plate the RP1616 cells with the motility construct on Plates containing different concentrations of theophylline. The cells which are plated where no theophylline is present are not expected to migrate from their original placement; Cells plated on relatively low concentrations (0.1 µM theophylline) are expected to migrate only slightly; and cells plated at moderate concentrations of theophylline (1 µM) are expected to migrate a fair distance; cells which are plated at concentration above the threshold for survival (1.5 – 2.0 µM) are not expected to survive.
The third method for determining relative motility is to view the movement of the cells via a microscope. Control cells (DH5a) are expected to have superb motility; RP1616 cells transformed with the motility construct are expected to behave differently at different concentrations of theophylline. Cells where no theophylline is present are expected to experience on a tumbling-like motion. Cells where low concentrations of theophylline are present are expected to mostly tumble, but some running is expected. Cells which are present under moderate concentrations of theophylline are expected to exhibit mostly a running motion. Cells which are present at theophylline concentrations above the threshold for survival are not expected to exhibit any motility whatsoever.
Electron microscopy
The Magnetite nanoparticle producing construct, pLacI:sRBS:mms6:dT, is expected to produce uniform nanoparticles. In order to visualize the size and shape of the nanoparticles we intend to use electron microscopy. With the aid of the electron microscope it is possible to visualize particles on the nanoscale. For this we will need to overexpress the protein (see gene expression) with IPTG. The magnetite, Fe3O4, nanoparticles form in the presence of FeCl2. Varying concentrations of FeCl2 will be added to the cells. After 24 hours, the cells will be opened up using chemical, mechanical and chemical/mechanical techniques, in order to determine if this poses any significant difference on the nanoparticles themselves. The nanoparticles are insoluble, and therefore can be filtered off from the cell lysate and washed. There are different types of filters which can be used to collect nanoparticles, we will use thin polycarbonate membrane as our filter of choice since the nanoparticles which we expect to obtain are on the smaller scale (6-20 nm in diameter). We will then place the sample under the electron microscope to visualize our magnetite nanoparticles.
Fluorescence
Fluorescence will be used to determine the localization of a single fluorescent protein within our microcompartments. In order to do this, we will have to overexpress our Lumazine microcompartments using IPTG. Since we are not sure if the microcompartments from around our proteins, or if the proteins are targeted into the microcompartments we will perform the experiment in two different ways.
- The lumazine synthase will be induced and the microcompartments will be allowed to form while the expression of the fluorescent protein (either YFP or CFP) is repressed using the Tetracycline inverter, which we have chosen to induce with the pBAD promoter (controlled by the presence of Arabinose). An arabinose pulse is added to repress the expression of the fluorescent protein, after some time, the arabinose will be used up and natural expression of the fluorescent protein will occur.
- The lumazine synthase will be induced and the microcompartments will be allowed to form while expression of the fluorescent protein is allowed to take place. No arabinose is added.
The cells will then be visualized in the fluorimeter. In order to determine if the fluorescent proteins are localized with the microcompartments, it may be useful to visualize the cells with the aid of a confocal microscope. This will allow us to determine if the fluorescence is localized to specific points with the cells.
FRET
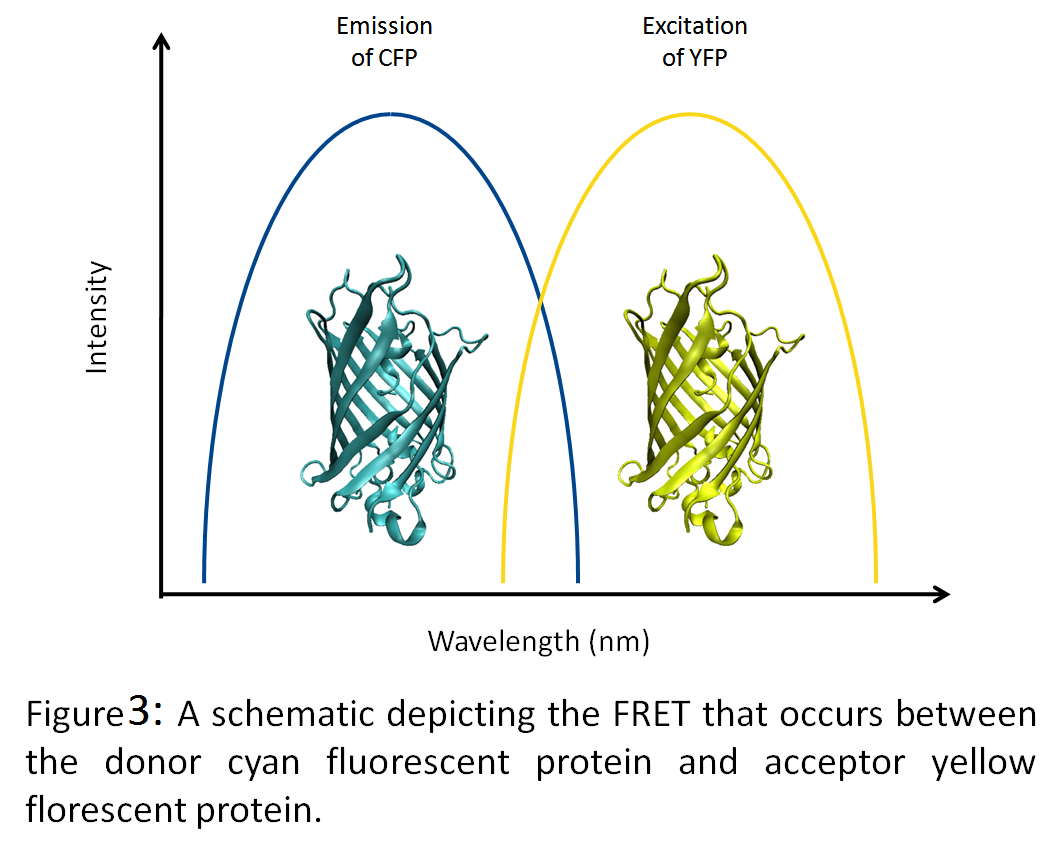
Fluorescence Resonance Energy Transfer, FRET will be used to determine the colocalization of two fluorescent proteins within the microcompartment. Yellow Fluorescent Protein (YFP) and Cyan Fluorescent Protein (CFP) are FRET pairs and are thus perfect for this application. The way that FRET works is that a donor molecule, in this case CFP, is excited by the application of an initial wavelength. The excited CFP emits fluorescence energy at a wavelength similar to that at which the acceptor molecule, in this case YFP, is excited. The fluorescence energy is thus transferred from molecule to another at that resonance wavelength. The acceptor molecule then emits fluorescence energy of its own at a wavelength which is distinguishable from the rest of the excitation and emission wavelengths. The energy transfer is distance dependent. If the two molecules are close in proximity (1 – 10 nm) the energy is transferred efficiently. The further away the two molecules are, the less efficient the energy transfer, and finally if the two molecules are too far away (more than 10 nm apart) the energy will not be transferred at all. CFP is excited at 436 nm, and emits fluorescence energy at 480 nm. YFP is excited at 514 nm and emits fluorescence energy at 538 nm. If the two fluorescent proteins are colocalized within the microcompartment, then one would expect that efficient fluorescence energy transfer would occur. If the two proteins are not colocalized, then one would expect not to see any fluorescent energy transfer. In order to show fluorescence energy transfer, the intrinsic fluorescence of the cell will be used as a background, and the fluorescence of CFP alone in the cell will be compared to the fluorescence of CFP alone inside the microcompartment.
RiPS measurements
In a similar way, fluorescence can be used to assess the theophylline riboswitch and rpsA TIR efficiencies, by generating values for the Ribosome initiation per second (or RiPS).
- pStrong:Riboswitch:GFP:dT
- pStrong:rpsA TIR:GFP:dT
Both the riboswitch and TIR act as alternative Ribosomal Binding Sites (RBS), by using GFP as the expression portion of these constructs it is possible to provide a calculation for the RiPS of these two parts. The parts are inserted in a RiPS generating plasmid (GFP producing plasmid). The fluorescence of GFP can be quantitatively measured using a fluorimeter. The fluorescence of GFP is measured over time and the Rise time, and expression time of the fluorescence is measured. These values are imported into a modelling program and the value for RiPS is generated for each of these parts. In order to measure the RiPS for the theophylline riboswitch, GFP’s fluorescence must be measured under varying concentrations of theophylline (0.1 µM, 0.25 µM, 0.5 µM, 0.75 µM, 1.0 µM, 1.25 µM, 1.5 µM and 2.0 µM). In order to measure the RiPS for the rspA TIR, GFP’s fluorescence must be measure under various stress conditions (i.e. Minimal media, heat, cold, various toxins, etc).
Results
Fluorescence
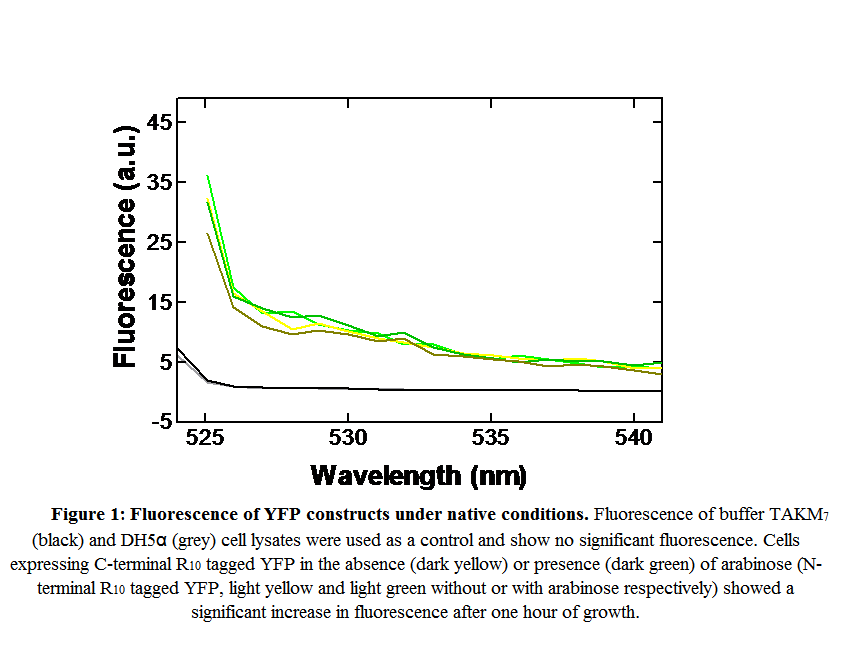
Two constructs (EYFP with either N- or C-terminal 10Arg (10R) tags) were characterized by the following procedure, either in the presence or absence of 0.4% w/v arabinose.
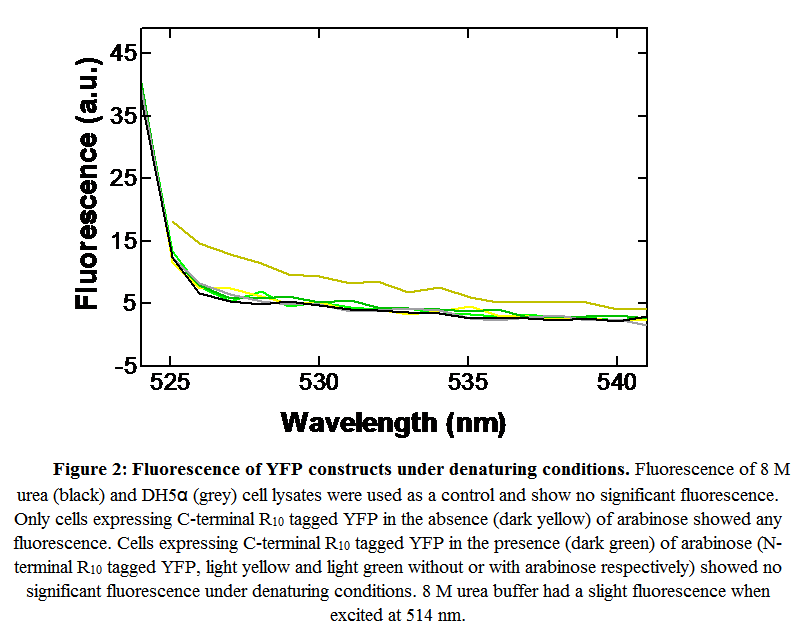
Briefly, 5 mL cultures (LB + 10 mg/mL ampicillin, with or without 0.4 % w/v arabinose) were inoculated with 1 mL of previously prepared culture of E. coli DH5α containing the EYFP constructs. After 1 hour growth at 37 °C (with shaking), 1 mL of the culture was harvested. Cells were centrifuged (13500 g, 5 min) and resuspended in 1 mL of either 8 M urea or buffer TAKM7 (50 mM Tris-Cl pH 7.5 at room temperature, 30 mM NH4Cl, 70 mM KCl, 7 mM MgCl2) containing 1 mg/mL lysozyme. Following a 10 min incubation at room temperature, cell debris was removed by centrifugation (13500 g, 5 min). The fluorescence of the resulting clear cell debris was determined using a Varian Cary Eclipse Fluorescence Spectrophotometer in quartz cuvettes, referenced with respect to the background fluorescence of either 8 M urea or buffer TAKM7. The fluorescence of EYFP was excited at 514 nm; the fluorescence emission was measured through 5 nm slits from 520 to 600 nm. The results are summarized below:
These results indicate that cells express either N- or C-terminal 10R tagged YFP, as shown by an increase in the fluorescence of cleared cell lysates. This fluorescence can be removed by treating cell lysates with 8 M urea, which would denature the protein, reducing the fluorescence of the lysate. This is demonstrated by a change of 10 fluorescence units between total cellular proteins under native conditions compared to denaturing conditions.
Sequencing
 "
"

