Team:Wash U/Biological Parts
From 2009.igem.org
(→Simulating A Bioreactor) |
(→Simulating A Bioreactor) |
||
| (17 intermediate revisions not shown) | |||
| Line 346: | Line 346: | ||
<br><br><br> | <br><br><br> | ||
=='''Simulating A Bioreactor'''== | =='''Simulating A Bioreactor'''== | ||
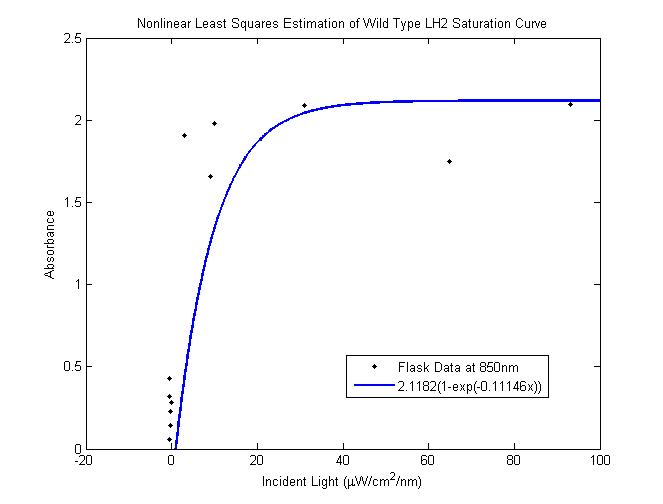
| - | + | Nonlinear least squares estimation of wild type saturation curve <br> | |
| - | + | ||
| - | + | ||
| - | Nonlinear least | + | |
[[Image: saturation for WT as inferred.png|450px|left]] <br> | [[Image: saturation for WT as inferred.png|450px|left]] <br> | ||
| - | + | '''Problem:''' <br> | |
| - | + | In a typical reactor, cells at the surface absorb more than enough light to saturate their | |
| - | + | ||
| - | + | ||
| - | ''' | + | |
| - | + | ||
| - | + | ||
| - | + | ||
| - | + | ||
| - | + | ||
| - | + | ||
| - | + | ||
| - | + | ||
| - | + | ||
photosynthetic apparatus, transmitting less energy to deeper layers. Cells operating past the saturation point | photosynthetic apparatus, transmitting less energy to deeper layers. Cells operating past the saturation point | ||
waste incident photons by non-photochemical quenching and possibly undergo photodamage. For wild type cells, the | waste incident photons by non-photochemical quenching and possibly undergo photodamage. For wild type cells, the | ||
| Line 371: | Line 356: | ||
receive an overabundance of photons and in turn block the interior layers from receiving enough light. In an | receive an overabundance of photons and in turn block the interior layers from receiving enough light. In an | ||
optimal reactor, all layers would operate near their respective saturation points to maximize the photosynthetic | optimal reactor, all layers would operate near their respective saturation points to maximize the photosynthetic | ||
| - | channeling of incident light energy. | + | channeling of incident light energy. |
| + | <br><br><br><br><br><br><br><br> | ||
| + | [[Image:Washu_eq_2.jpg|300px|left]] <br> | ||
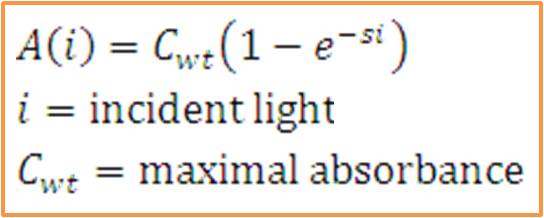
The total saturation curve for wild type R. Sphaeroides was fit with a nonlinear least squares regression of the | The total saturation curve for wild type R. Sphaeroides was fit with a nonlinear least squares regression of the | ||
| - | form in | + | form in the corresponding equation. Data points were generated from calculating absorbance as the negative logarithm of the ratio of the absolute irradiance detected on the next layer to incident absolute irradiance on a layer of cells. A logistic form was chosen to account for the diminishing returns to absorption of further photons past a threshold operating capacity of the photosynthetic apparatus. (1) |
| - | of the absolute irradiance detected on the next layer to incident absolute irradiance on a layer of cells. A | + | <br><br><br> |
| - | logistic form was chosen to account for the diminishing returns to absorption of further photons past a threshold | + | |
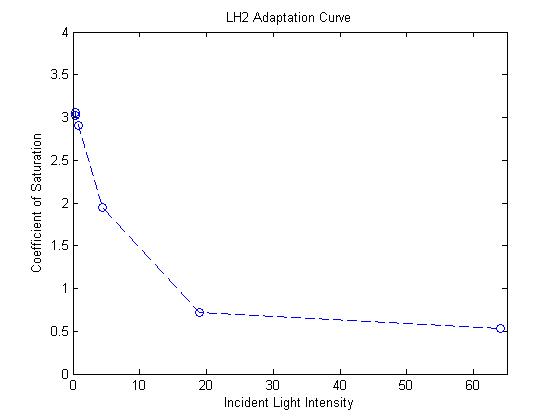
| - | operating capacity of the photosynthetic apparatus. (1) | + | Exponential response curve for mutant LH2 saturation coefficients <br> |
| - | <br> | + | [[image:lh2adaption.jpg|450px|left|]] <br> |
| - | '''Simulating our Mutant's advantage in a Bioreactor''' | + | '''Simulating our Mutant's advantage in a Bioreactor''' <br> |
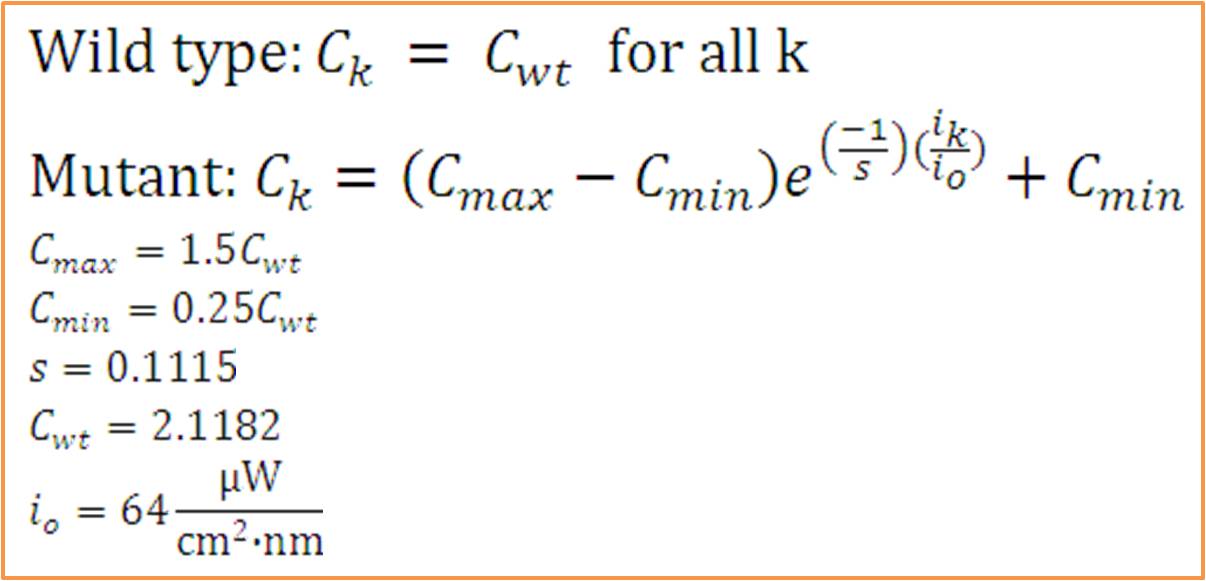
For our mutant cells, the LH2 saturation curve for each layer scales as a function of light intensity. This | For our mutant cells, the LH2 saturation curve for each layer scales as a function of light intensity. This | ||
predicted behavior in the mutant is due to negative regulation of LH2 complex production as incident light | predicted behavior in the mutant is due to negative regulation of LH2 complex production as incident light | ||
| Line 385: | Line 372: | ||
vary expression levels such that at high light intensities, the saturation curve is scaled to 25% of that of the | vary expression levels such that at high light intensities, the saturation curve is scaled to 25% of that of the | ||
wild type. At low light intensities, LH2 production was assumed to have the potential to be up-regulated to 150% | wild type. At low light intensities, LH2 production was assumed to have the potential to be up-regulated to 150% | ||
| - | of wild type expression levels. | + | of wild type expression levels. <br> |
The advantage this mutant would confer stems from the adaptive nature of the saturation curve heights. Cells | The advantage this mutant would confer stems from the adaptive nature of the saturation curve heights. Cells | ||
receiving the most light on the outside of the bioreactor saturate at low absorption levels. This allows more | receiving the most light on the outside of the bioreactor saturate at low absorption levels. This allows more | ||
light to transmit to further layers, which have elevated saturation curves due to lower incident light. | light to transmit to further layers, which have elevated saturation curves due to lower incident light. | ||
| - | <br><br> | + | <br> <br> <br> <br> <br> |
| - | Assumptions: | + | [[Image:washu_eq_1.jpg|500px|center]] |
| + | '''Model Assumptions''' <br><br><br><br> | ||
| + | [[image:simulationequations.png|200px|left]]<br> | ||
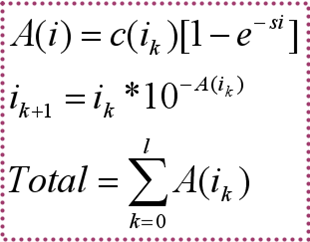
- Light intensity at next layer is given by transmittance from previous layer (assumes no backscattering).<br> | - Light intensity at next layer is given by transmittance from previous layer (assumes no backscattering).<br> | ||
- Total energy funneled to photosynthetic pathways is estimated as the sum of light absorbed by each layer. This | - Total energy funneled to photosynthetic pathways is estimated as the sum of light absorbed by each layer. This | ||
| - | generalizes to the optical density measurement of cell culture density. | + | generalizes to the optical density measurement of cell culture density. <br> <br> <br> <br> <br> <br> <br> |
- The constant wild type saturation curve inherently includes both LH2 and LH1 contributions to absorbance. The | - The constant wild type saturation curve inherently includes both LH2 and LH1 contributions to absorbance. The | ||
mutant's variable saturation curve only accounts for LH2 absorbance, since this is the only complex under the | mutant's variable saturation curve only accounts for LH2 absorbance, since this is the only complex under the | ||
| Line 402: | Line 391: | ||
20% of total optical density can be attributed to LH1. To account for this, the absorption in the mutant was | 20% of total optical density can be attributed to LH1. To account for this, the absorption in the mutant was | ||
divided by the factor (1-0.2) = 0.8. Then, the total optical density of the mutant cultures reflects total | divided by the factor (1-0.2) = 0.8. Then, the total optical density of the mutant cultures reflects total | ||
| - | absorption by both LH1 and LH2. | + | absorption by both LH1 and LH2. <br> <br> <br> <br> |
| - | + | Relative growth of DBComega to WT in Flask 2 at OD600 <br> | |
| - | + | [[Image:relative growth.png| 600px | left]]<br> <br> <br> <br> <br> | |
| - | + | ||
| - | + | ||
| - | + | ||
| - | + | ||
| - | + | ||
| - | + | ||
| - | + | ||
| - | + | ||
| - | + | ||
| - | + | ||
| - | + | ||
- The model was revised upon gathering optical density data from the five layers of the bioreactor setup. (See | - The model was revised upon gathering optical density data from the five layers of the bioreactor setup. (See | ||
Results Figure 2a.) In the wild type, the optical density of the first flask of cells was much lower than | Results Figure 2a.) In the wild type, the optical density of the first flask of cells was much lower than | ||
| Line 425: | Line 403: | ||
- The response curve for the coefficient of saturation for the mutant due to changes in light intensity was modeled | - The response curve for the coefficient of saturation for the mutant due to changes in light intensity was modeled | ||
as an inverse exponential form. In other words, the system reacts to increasing light intensity by exponentially | as an inverse exponential form. In other words, the system reacts to increasing light intensity by exponentially | ||
| - | tapering the coefficient of saturation. | + | tapering the coefficient of saturation.<br> <br> <br> |
| - | + | <br> | |
<br> | <br> | ||
<br> | <br> | ||
| + | <font size="3"> | ||
| + | <div style="text-align: center;"> | ||
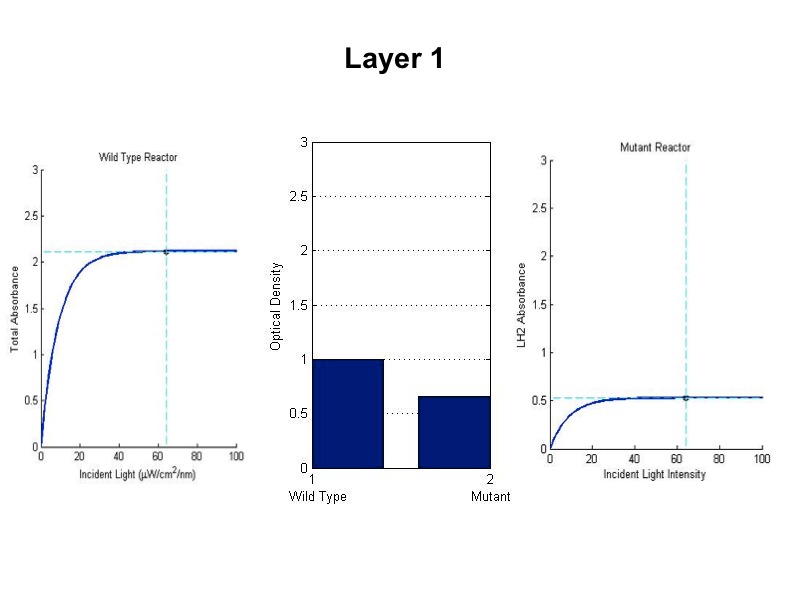
| + | Wild Type vs. Mutant Photobioreactor Simulation <br> | ||
<font size="2"> | <font size="2"> | ||
[[Image:wtvsmutsim1.jpg|450px|left]][[Image:wtvsmutsim2.jpg|450px|right]] | [[Image:wtvsmutsim1.jpg|450px|left]][[Image:wtvsmutsim2.jpg|450px|right]] | ||
<br><br><br><br><br><br><br><br><br><br><br><br><br><br><br><br><br><br><br> | <br><br><br><br><br><br><br><br><br><br><br><br><br><br><br><br><br><br><br> | ||
| - | |||
| - | |||
[[Image:wtvsmutsim3.jpg|450px|left]][[Image:wtvsmutsim4.jpg|450px|right]] | [[Image:wtvsmutsim3.jpg|450px|left]][[Image:wtvsmutsim4.jpg|450px|right]] | ||
<br><br><br><br><br><br><br><br><br><br><br><br><br><br><br><br><br><br><br> | <br><br><br><br><br><br><br><br><br><br><br><br><br><br><br><br><br><br><br> | ||
| - | |||
[[Image:wtvsmutsim5.jpg|600px|center]] | [[Image:wtvsmutsim5.jpg|600px|center]] | ||
| - | + | <br><br><br><br><br><br> | |
| - | type | + | |
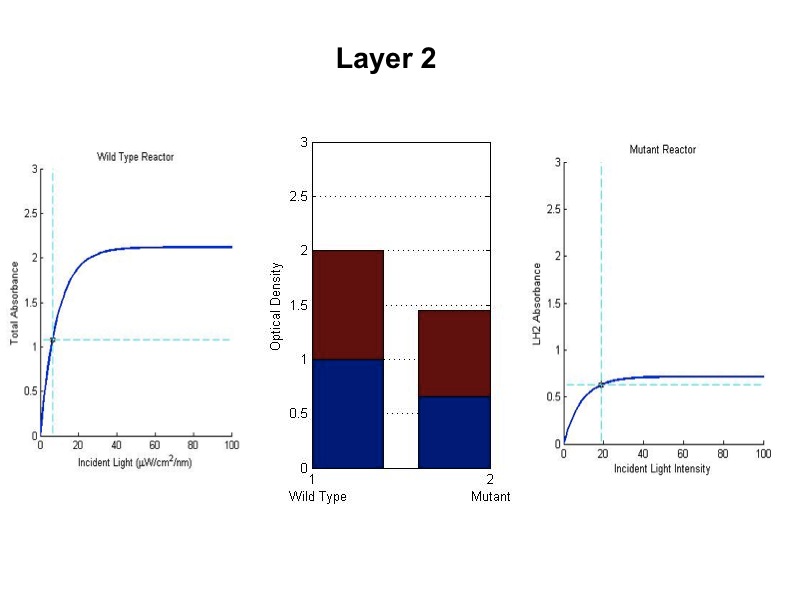
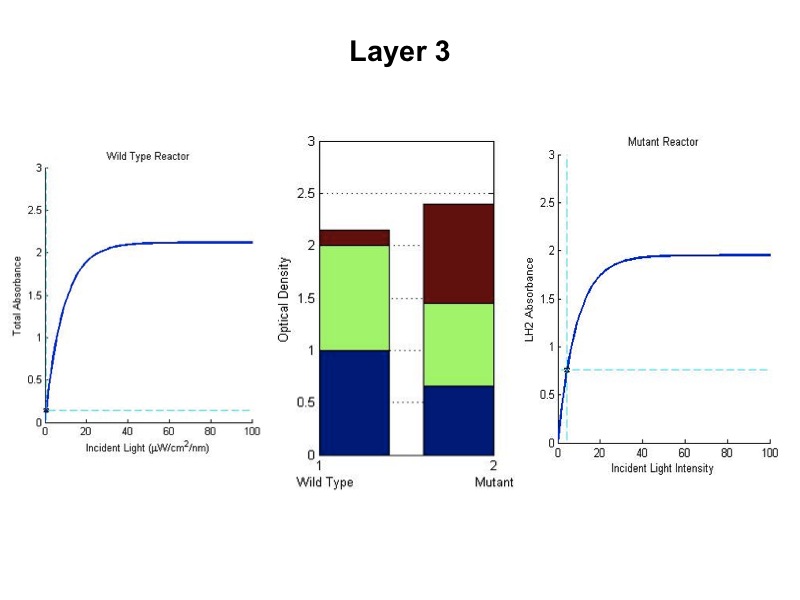
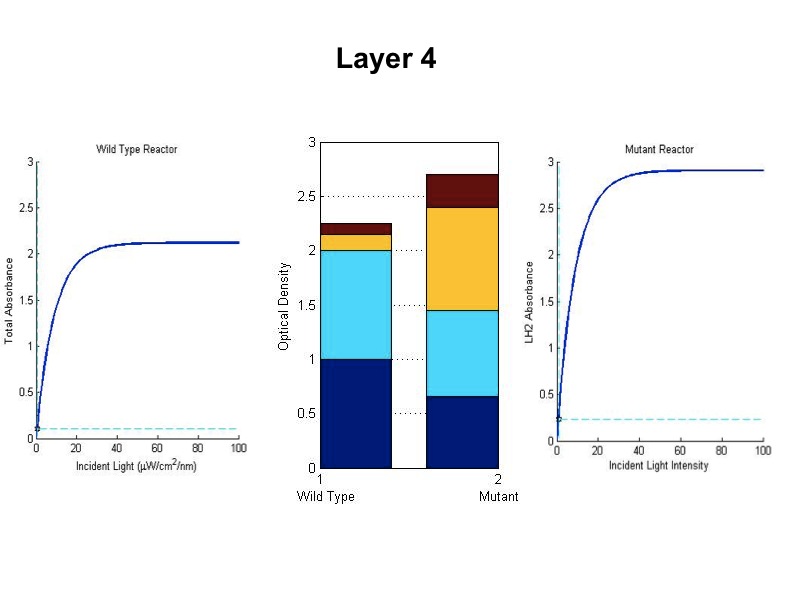
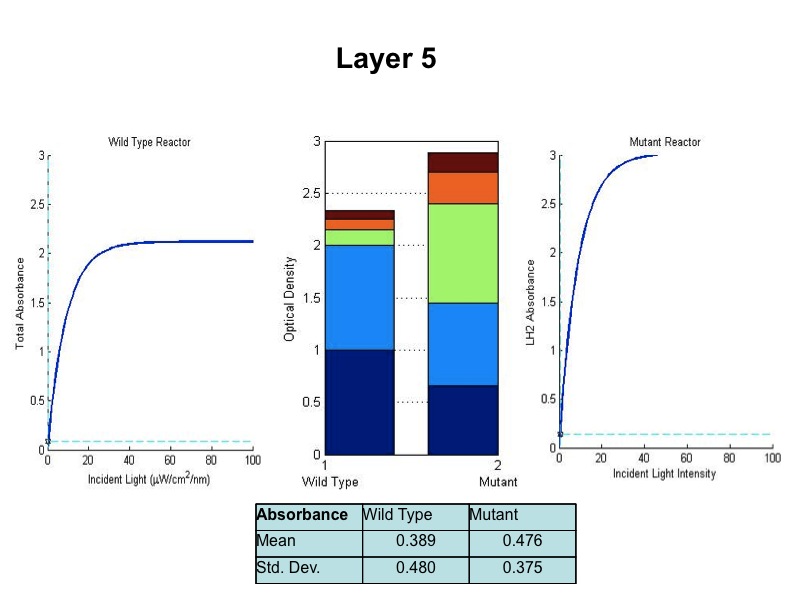
| + | The sequence of figures above shows the behavior of the static wild type saturation curve and the mutant variable saturation curve in response to incident light intensity. The dotted lines indicate the point of incident intensity and the associated absorbance with that point. The center stacked bar graph shows the accumulation of optical density given by the absorbance readings from the saturation curve. Recall that the mutant curve includes only LH2 adaptation, while the curve on the left is the total of LH1 and LH2 contributions to absorbance. Throughout the entire five layers of the bioreactor, it is evident from the simulation that the mutant achieved higher overall growth as indicated by OD. Also, the mean OD for the mutant exceeds that of wild type, and there is less variation in the levels about the mean (indicated by standard deviation). | ||
| + | |||
<div style="text-align: left;"> | <div style="text-align: left;"> | ||
| - | + | <br> | |
'''References''' | '''References''' | ||
Latest revision as of 03:59, 22 October 2009

 "
"
