 "
"
Team:Uppsala-Sweden/Modelling
From 2009.igem.org

The System
The Uppsala iGEM team of 2009 is trying to produce alcohols, specifically ethanol and isobutanol, in the Cyanobacterium Synechocystis sp PCC6803. in the butanol approach we really only have one controllable variable which is the expression level of the enzymes in the pathway making this uninteresting to model. For the ethanol we do however have two variables which we can control as we're not only expressing enzymes aimed at a specific reaction but are also trying to increase the substrate levels for that reaction. In order to accomplish this we are trying two ways to inhibit the PDC, one protein mediated inhibition, the pirAB proteins, and one antisense RNA mediated.
We will here try to supply a model for the ethanol production in Synechcystis.
Modelling of Ethanol Production

The system as modelled below, excerpt and simplification of this Schematic View
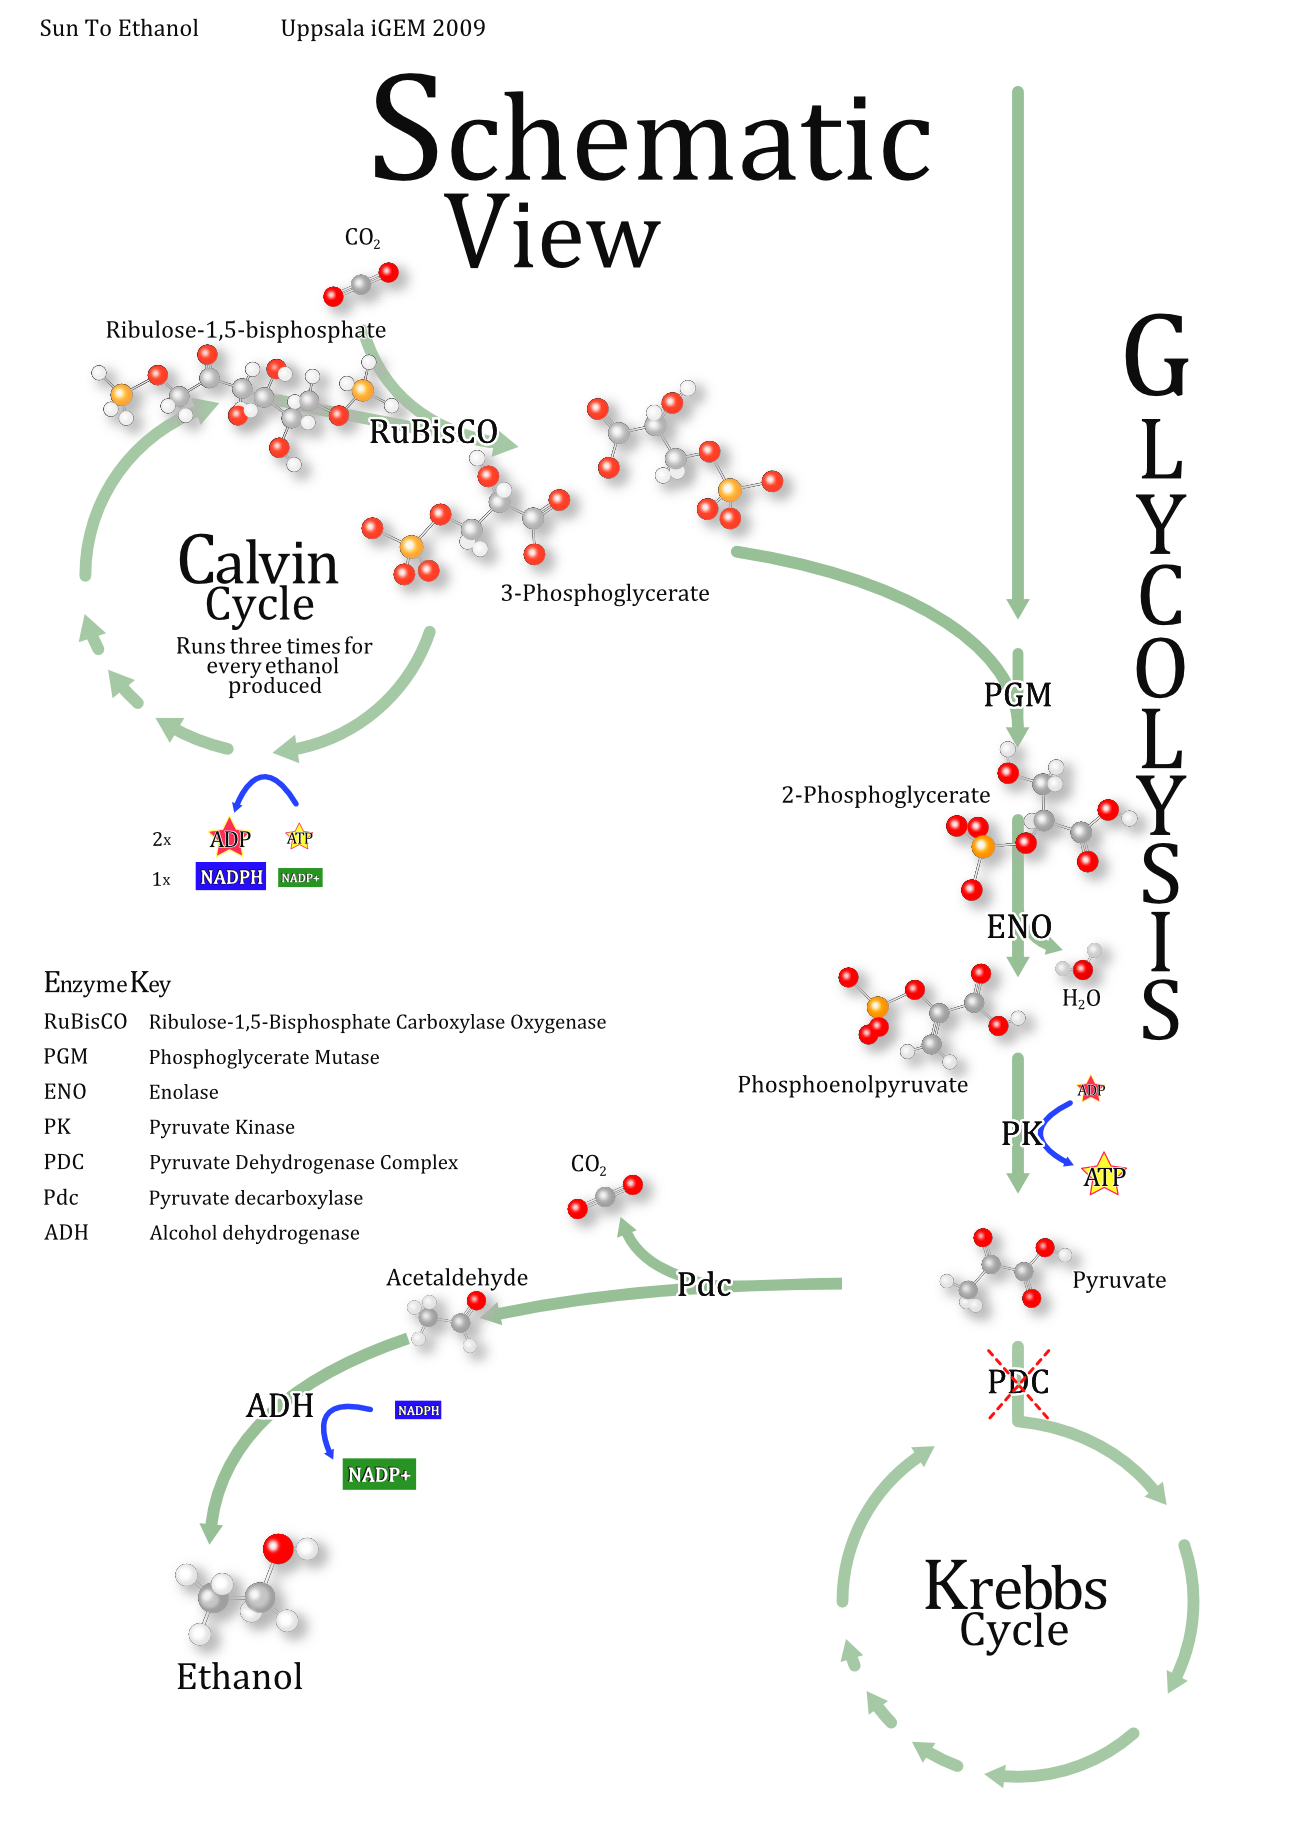
In order to be able to model the system under the restraints mentioned above we have made some basic assumptions:
1. Co-evolution of the of the ethanol producing pathway, this making Km and kcat highly similar for the pdc and Adh2.
This assumption is quite logic as these enzymes comes from the same metabolic pathway in the native organism. In practice this assumption makes it possible for us to model the system as a knowing the characteristics of only one of the enzymes, making characterisation easier.
2. Assuming quasi steady state (Michaelis Menten Kinetics), that is constant total enzyme and substrate concentration.
This is reasonable during log-phase when cell volumes are constant and before ethanol starts to inhibit growth.
Assumption #2 leads to equation (a)
(a)![]()
Where e is the amount of free enzyme and es is the amount of enzyme bound to substrate and e0 being the total concentration of enzyme.
Assumption #2 also gives equation (b) being simply the expression for the change of substrate concentrations over time, that is influx minus outflux. If we assume constant substrate concentration as in #2 the change in product concentration is given by influx substrate ks minus outflux through other paths than ethanol kt*s. Rewritten this yields equation (c).
(b & c) 
Where ks is the rate of substrate formation (flux of the glycolysis), kcat is the maximum number of enzymatic reactions catalyzed per second for the intoduced pathway, kt is the rate constant for the loss of substrate to other pathways, in our case primarily to the Krebbs cycle, Km is the substrate concentration at half the maximum reaction rate (Vmax) and s is the substrate concentration.
Having the Km and Kcat values (obtained in literature) gives e0 from the level of product formation, rewritten equation (c).
(d) 
3. Having e0 and letting kt go towards zero gives ks. kt can be assumed to approach zero provided that the Krebbs cycle is the main native consumer of pyruvate and that the inhibition of the PDC is successful. Gives a rearranged equation (b).
(e) 
4. Assuming ks to be constant within the interval and assuming steady-state (ds/dt = 0) and rearranging to a 2:nd degree equation which is easily solved numerically.
(f) 
S is a function of f(x,y) where x is proportional to e0 and y is proportional to kt through the fitting constants A and B which are determined by measuring the substrate (pyruvate) concentration at different levels of enzyme concentration and inhibition of the PDC. In other words this correlates with the activity of the promoters for the ethanol construct and the PDC inhibiting construct determining the two main outflux paths for pyruvate respectively. These are then the two factors we can change in the system by using two different inducible promoters.
The solution to the equation (f) gives a negative square root as the second answer which can be disregarded as both A and B are always positive and negative substrate levels are not physically acceptable.
(g) 
Measure for different x and y (activity of the two promoters) and fit the function to data through A and B.
Integrating (c) gives the final expression for product levels dependent only on the activity of the promoters, given our assumptions are reasonably correct. The assumption that we don't have any product (ethanol) at t=0 gives D=0
(h) 
Through this equation (h) we can at various levels of substrate determined by (g) optimize the promoter activities for the ethanol construct and the PDC inhibiting construct so that maximum product yield is reached.
Utilization
Employing this model we could with two inducible promoters make experiments and then determine the optimal levels for those promoters. The model is however built upon a number of assumptions and while they are altogether sane the model is still greatly simplified.
This raises the question whether this is the right way to go if our only goal is to increase yield. If we in any case has to do experiments with different levels of expression from the promoters we could as well do a Simplex optimization of the system and automatically adapt for feedback loops, product toxicity and other complicating factors.
The model could be of use if we want to investigate assumptions that we have made of the systems and through that improve our understanding of the different pathways. This making it possible to better guess what the next step should be to increase the production of ethanol.