|
Here we describe the characterization results of 4 parts of our own design, 2 existing parts re-built because they were inconsistent and 7 existing parts taken from the Registry. When not reported differently, all the experiments have been performed according to Growth conditions and Data analysis sections.
Our new parts:
Re-built existing parts (BBa_our part code/BBa_existing part code):
Existing parts from the Registry:
Existing parts - sequence debugging:
Growth conditions
Microplate reader experiments
- 8 ul of long term storage glycerol stock were inoculated in 5 ml of LB + suitable antibiotic in a 15 ml falcon tube and incubated at 37°C, 220 rpm for about 16 hours.
- The grown cultures were then diluted 1:100 in 5 ml of LB or M9 supplemented medium and incubated in the same conditions as before for about 4 hours.
- These new cultures were diluted to an O.D.600 of 0.02 (measured with a TECAN F200 microplate reader on a 200 ul of volume per well; it is not comparable with the 1 cm pathlength cuvette) in a sufficient amount of medium to fill all the desired microplate wells.
- These new dilutions were aliquoted in a flat-bottom 96-well microplate, avoiding to perform dynamic experiments in the microplate frame (see Frame effect section for details). All the wells were filled with a 200 ul volume.
- If required, 2 ul of inducer were added to each single well.
- The microplate was incubated in the Tecan Infinite F200 microplate reader and fluorescence (when required) and absorbance were measured with this automatic protocol:
- 37°C constant for all the experiment;
- sampling time of 5 minutes;
- fluorescence gain of 50;
- O.D. filter was 600 nm;
- GFP filters were 485nm (ex) / 540nm (em);
- 15 seconds of linear shaking (3mm amplitude) followed by 10 seconds of waiting before the measurements in order to make a homogeneous culture.
- Variable experiment duration time (from 3 to 24 hours).
Fermentation experiments
PROTOCOL#1
- 8 ul of long term storage glycerol stock were inoculated in 8 ml of LB + suitable antibiotic in a 15 ml falcon tube and incubated at 37°C, 220 rpm in anaerobic conditions for about 16 hours. This step will be indicated as FIRST INOCULUM.
- The culture was diluted 1:100 into 17 ml of LB + suitable antibiotic and incubated at 37°C, 220 rpm for about 6 hours (anaerobic). This step will be indicated as SECOND INOCULUM.
- After 6 hours, 17 ml of a filter-sterilized LB + suitable antibiotic + 20% glucose was added to the culture (yielding a final 34 ml culture + 10% glucose). It was also induced in this step when required. It was incubated under the same conditions as before for 48 hours.
- After 48 hours, the pH of the culture was measured through Litmus test and the culture was centrifuged at 4°C, 9000 rpm for 15 minutes.
- Finally, the supernatant was analyzed through gas chromatography or potassium dichromate kit.
PROTOCOL#2
- 8 ul of long term storage glycerol stock were inoculated in 8 ml of LB + suitable antibiotic + 2% of glucose in a 15 ml falcon tube and incubated at 37°C in unshaked anaerobic conditions for about 24 hours. This step will be indicated as FIRST INOCULUM.
- The culture was centrifuged at 25°C, 2500 rpm for 10 minutes.
- Supernatant was discarded and the resuspended pellet was inoculated into 30 ml of LB + suitable antibiotic + 10% of glucose in a 50 ml falcon tube and this new culture was induced (when required) and incubated at 37°C, 220 rpm for 48 hours (anaerobic). This step will be indicated as SECOND INOCULUM.
- After 48 hours, the pH of the culture was measured through Litmus test and the culture was centrifuged at 4°C, 9000 rpm for 15 minutes.
- Finally, the supernatant was analyzed through gas chromatography or potassium dichromate kit.
PROTOCOL#3
- 8 ul of long term storage glycerol stock were inoculated in 8 ml of LB + suitable antibiotic + 2% of glucose in a 15 ml falcon tube and incubated at 37°C, 220 rpm anaerobic conditions for about 24 hours. This step will be indicated as FIRST INOCULUM.
- After 24 hours, 300 ul of the grown culture were inoculated into 30 ml of LB + suitable antibiotic + 10% glucose.
- The new 30 ml culture was induced when required and it was incubated under the same conditions as before for 24 or 48 hours (anaerobic). This step will be indicated as SECOND INOCULUM.
- After 24 or 48 hours, the pH of the culture was measured through Litmus test and the culture was centrifuged at 4°C, 9000 rpm for 15 minutes.
- Finally, the supernatant was analyzed through gas chromatography or potassium dichromate kit.
Data analysis
Growth curves
All our growth curves have been obtained subtracting for each time sample the broth O.D.600 measurement from that of the culture; broth was considered in the same conditions of the culture (e.g. induced with the same inducer concentration).
Doubling time
The natural logarithm of the growth curves (processed according to the above section) was computed and the linear phase (corresponding to the bacterial exponential growth phase) was isolated by visual inspection. Then the linear regression was performed in order to estimate the slope of the line m. Finally the doubling time was estimated as d=ln(2)/m [minutes].
In the case of multiple growth curves for a strain, the mean value of the processed curves was computed for each time sample before applying the above described procedure.
Relative Promoter Units (RPUs)
The RPUs are standard units proposed by Kelly J. et al., 2008, in which the transcriptional strength of a promoter can be measured using a reference standard, just like the ground in electric circuits.
RPUs have been computed as:
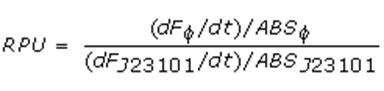
in which:
- phi is the considered promoter and J23101 is the reference standard promoter (taken from Anderson Promoter Collection);
- F is the blanked fluorescence of the culture, computed subtracting for each time sample fluorescence measure for negative control from that of culture, where the negative control is a non-fluorescent strain (in our experiment it is usually used TOP10 strain bearing or , which are symmply RBSs do not have expression systems for reporter genes);
- ABS is the blanked absorbance (O.D.600) of the culture, computed as described in "Growth curves" section.
RPU measurement has the following advantages (under suitable conditions)
- it is proportional to PoPS (Polymerase Per Second), a very important parameter that expresses the transcription rate of a promoter;
- it uses a reference standard and so measurements can be compared between different laboratories.
The hypotheses on which RPU theory is based can be found in Kelly J. et al., 2008, as well as all the mathematical steps. From our point of view, the main hypotheses that have to be satisfied are the following:
- the reporter protein must have a half life higher than the experiment duration (we use GFPmut3, , which has an estimated half life of at least 24 hours, and the experiments duration is always less than 7 hours);
- strain, plasmid copy number, antibiotic, growth medium, growth conditions, protein generator assembled downstream of the promoter must be the same in the promoter of interest and in J23101 reference standard.
- steady state must be valid, so (dF/dt)/ABS (proportional to the GFP synthesis rate per cell) must be constant.
Inducible systems
Every experiment is performed on the following cultures:
- the culture of interest (system studied expressing GFP)
- the benchmarck used to evaluate R.P.U. ( measurement part, that is with downstream)
- a negative control (generally, RBS)
For inducible systems several plots are reported. The first plot is a panel containing 4 subplots, numerated this way:
Plot (1) contains growth curves of the cultures, after blank value has been removed. Every curve is calculated averaging on three replicates of the same culture and subtracting the blank for each time sample. Blank is calculated averaging the replicates of blank wells.
Plot (2) shows the logarithm of absorbance in exponential phase of bacterial growth, determined by a visual inspection of log-plots. These values are used to evaluate doubling time and R.P.U..
Plot (3) contains (dGFP/dt)/O.D., the value named S_cell in Kelly J. et al., 2008 procedure for RPU evaluation.
In these plots are reported black veritcal lines that define the range of values used to evaluate RPU. It is important to underline, as explained in next paragraph, that RPU are calculated on cultures at the same O.D. level, not at the same time.
The second graphic shows S_cell VS O.D.. This plot allows the conparison of S_cell values between different cultures, that are supposed to reach the same level of growth not at the same time, but at the same O.D. value.
The third graphic shows the induction curve. The RPU value is calculated on S_cell values corresponding to O.D. values in exponential phase (typically, from 0.05 to 0.16).
The curve is obtained averaging in time S_cell values corresponding to exponential phase.
Error bars rapresent the minimum and maximum value of R.P.U. belonging to the range of O.D. in exponential phase.
In RPU evaluation the hypothesis of steady state has to be validated. This hypothesis corresponds to a constant behavior of S_cell in time. In exponential phase in several cases it is possible to observe that this variable isn't constant, but grows after exponential phase is over. This behaviour is totally unexpected and can't be justifyed by any biological argument.
It is also important to underline that the reported methodology has shown how variable R.P.U. value can be. This parameter, in fact, is very sensitive to the respondind O.D. value, as shown from induction curves, where error bars are sometimes wide among the curve. So it is foundamental to define a standardized methodology for RPU evaluation, not sensitive to O.D. or time choose.
Materials
- Long term glycerol stocks were stored at -80°C with a final glycerol concentration of 20%
- Antibiotics were: Ampicillin (Amp) 100 ug/ml, Kanamycin (Kan) 50 ug/ml and Chloramphenicol (Cm) 12.5 ug/ml. All of them were stored at -20°C in 1000x stocks. Amp and Kan were dissolved in water, while Cm was dissolved in ethanol 100%.
- LB medium was prepare with: 1% NaCl, 1% bactotryptone, 0.5% yeast extract. The medium was not buffered with NaOH.
- M9 supplemented medium was prepared according to: Openwetware protocol.
- 3OC6-HSL (Sigma) was dissolved in water and stored at -20°C in a 2mM stock.
- aTc (Clontech) was dissolved in ethanol 50% and stored at -20°C in a 100 ug/ml stock. All the following dilutions were performed in water.
- Ready made IPTG (Sigma) was stored at -20°C in a 200mM stock.
|
 "
"


