Notebook Flow Cytometry
Contents
9-21-2009
- All cells for flow cytometry were transfected with the promoter of interest in front of GFP and the reference plasmid with JeT and mCherry in a 2:1 ratio. This ratio was chosen to ensure that we have GFP in every cell expressing mCherry and thereby increasing the number of double positive cells.
- Time course measurement of 24 and 96 well plate (Fig. 1-2): Triplicates of cells transfected with the same promoter were loaded at different positions of the plates (Fig. 3-4) to ensure that the results do not change significantly over the time course of one flow cytometry measurement.
 Figure 1: Time measurement 24 well. The bars indicate each triplicate located at a different position on the plate as shown in the scheme below. The standard deviations of the replicates are indicated by the error bars. |
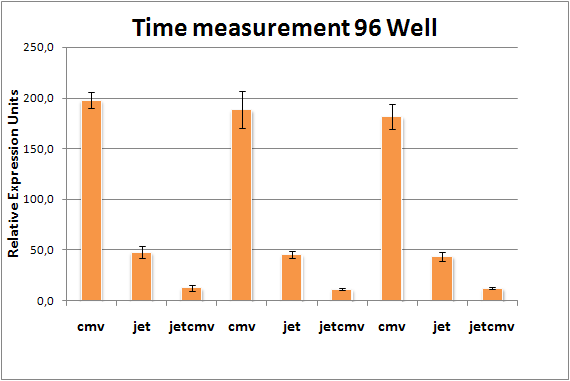 Figure 2: Time measurement 96 well. The bars indicate each triplicate located at a different position on the plate as shown in the scheme below. The standard deviations of the replicates are indicated by the error bars. |
 Table 1: 24 well loading scheme. The table represents the wells of a 24 well plate and the pink colored boxes indicating the loading wells. |
 Table 2: 96 well loading scheme. The table represents the wells of a 96 well plate and the pink colored boxes indicating the loading wells. |
9-24-2009
- We performed standard measurements in HeLa, U2OS and MCF7 with our three standard promoters: CMV, JeT and JeT-CMV. These measurements were performed in 3 independent measurements. The initial results of U2OS standard are shown below (Fig. 3), a standard measurement includes the constructs shown in table 3.
| Table 3: Sample
|
| negative control (transfection with a non-fluorescent plasmid p6)
|
| cotransfection with JeT plasmid and p6
|
| cotransfection with JeT_CMV plasmid and p6
|
| cotransfection with CMV plasmid and p6
|
| cotransfection with mCherry reference plasmid and p6
|
| cotransfection with CMV plasmid and mCherry reference plasmid
|
| cotransfection with JeT plasmid and mCherry reference plasmid
|
| cotransfection with JeT_CMV plasmid and mCherry reference plasmid
|
|
 Figure 3: Flow cytometry results of the U2-OS Standard plate (1st measurement). The three standard promoters CMV, JeT, and JeT_CMV were measured 20 hours after transfection of the U2-OS cells and their Relative Expression Units (REU) normalized to the JeT promoter are shown above.The standard deviations of the replicates are also shown. |
- We measured the synthetic constitutive promoters in the HeLa cell line. Unfortunately, the number of the viable cells are not enough for a reliable measurement.
9-25-2009
- Flow cytometric measurement of MCF-7 standard plate (Fig. 4), which includes the same samples as above (see table 3).
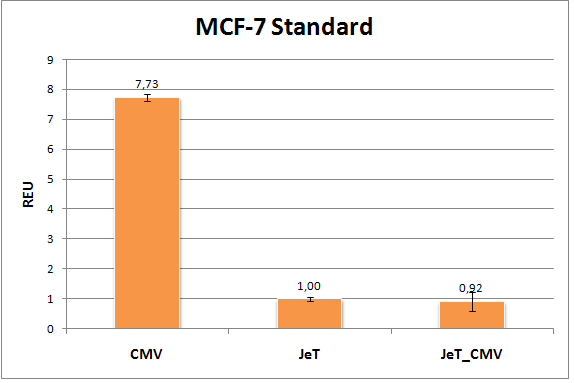 Figure 4: Flow cytometry results of the MCF-7 Standard plate (1st measurement).The three standard promoters CMV, JeT, and JeT_CMV were measured 20 hours after transfection of the MCF-7 cells and their Relative Expression Units (REU) normalized to the JeT promoter are shown above.The standard deviations of the replicates are also shown. 9-28-2009
- Second measurement of MCF-7 (Fig. 6) and U2-OS (Fig. 5) standard plates(same samples).
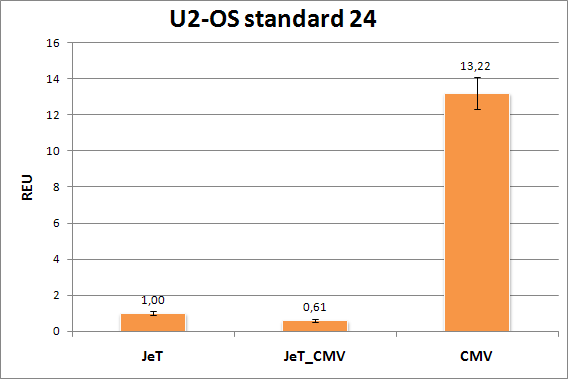 Figure 5: Flow cytometry results of the U2-OS standard plate(2nd measurement). The three standard promoters CMV, JeT, and JeT_CMV were measured 20 hours after transfection of the U2-OS cells and their Relative Expression Units (REU) normalized to the JeT promoter are shown above.The standard deviations of the replicates are also shown. |
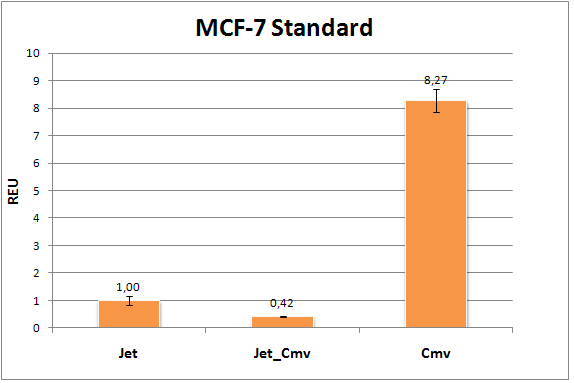 Figure 6: Flow cytometry results of the MCF-7 standard plate(2nd measurement).The three standard promoters CMV, JeT, and JeT_CMV were measured 20 hours after transfection of the MCF-7 cells and their Relative Expression Units (REU) normalized to the JeT promoter are shown above.The standard deviations of the replicates are also shown. |
9-29-2009
- Third flow cytometry measurement of the MCF-7 (Fig. 8) and the U2-OS (Fig. 7) standard plates. Results are shown in the diagrams below.
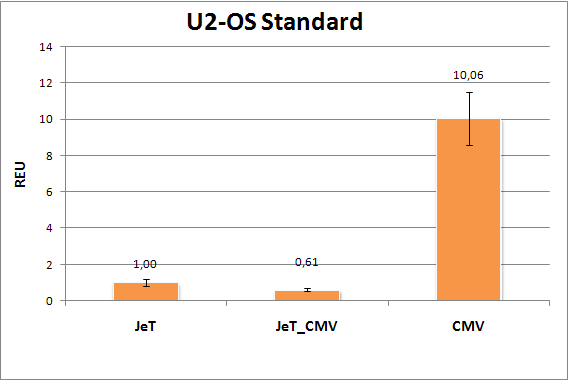 Figure 7: Flow cytometry results of the U2-OS Standard plate (3rd measurement).The three standard promoters CMV, JeT, and JeT_CMV were measured 20 hours after transfection of the U2-OS cells and their Relative Expression Units (REU) normalized to the JeT promoter are shown above.The standard deviations of the replicates are also shown. |
 Figure 8: Flow cytometry results of the MCF-7 Standard plate (3rd measurement). The three standard promoters CMV, JeT, and JeT_CMV were measured 20 hours after transfection of the MCF-7 cells and their Relative Expression Units (REU) normalized to the JeT promoter are shown above. The standard deviations of the replicates are also shown. |
9-30-2009
- Second measurement of the synthetic constitutive promoters in HeLa. Results shown below (Fig. 9).
 Figure 9: Flow cytometry results of the constitutive promoters in HeLa (1st measurement).The synthesized constitutive promoters of varying strength were measured 20 hours after transfection of the HeLa cells and their Relative Expression Units (REU) normalized to the JeT promoter are shown above.The standard deviations of the replicates are also shown . 10-02-2009
- We measured the synthetic NFkB responsive promoter plate in U2-OS after 10 hours of induction with TNF-alpha (Fig. 10).
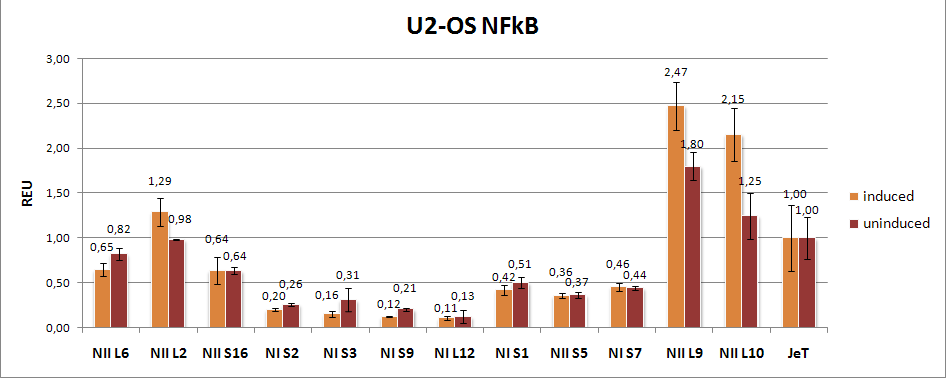 Figure 10: Flow cytometry results of the NFkB responsive promoters in U2-OS (1st measurement). The U2-OS cells were transfected with the different synthetic NFkB responsive promoters coupled to GFP. After 10 hours of induction with TNF-alpha the GFP fluorescence was measured by flow cytometry. The error bars represent the standard deviation. 10-03-2009
- We measured the synthetic HIF responsive promoter in MCF-7. Unfortunately, the cell number was too low.
10-05-2009
- Three independent measurements of HeLa standard plates (Fig. 11-13), which include the same samples as above (see table 3)
- We measured the synthetic constitutive promoters in the HeLa cell line again. Unfortunately, the number of the viable cells are not enough for a reliable measurement.
- We measured the synthetic AhR responsive promoters and the natural promoter CYP1A1 (AhR responsive promoter) in HeLa. Unfortunately, the number of the viable cells are not enough for a reliable measurement.
 Figure 11: Flow cytometry results of the HeLa Standard plate (1st measurement). The three standard promoters CMV, JeT, and JeT_CMV were measured 20 hours after transfection of the HeLa cells and their Relative Expression Units (REU) normalized to the JeT promoter are shown above. The standard deviations of the replicates are also shown. |
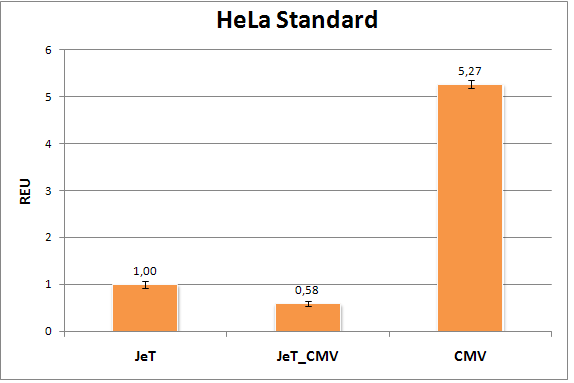 Figure 12: Flow cytometry results of the HeLa Standard plate (2nd measurement). The three standard promoters CMV, JeT, and JeT_CMV were measured 20 hours after transfection of the HeLa cells and their Relative Expression Units (REU) normalized to the JeT promoter are shown above. The standard deviations of the replicates are also shown. |
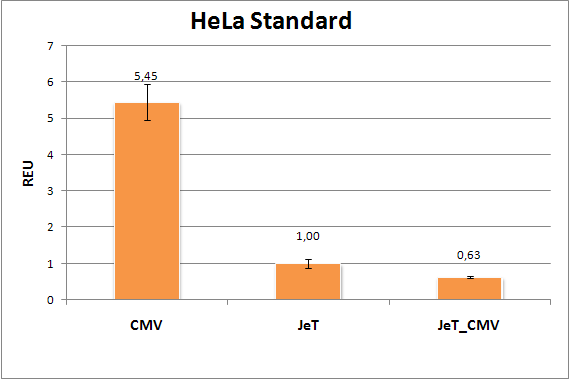 Figure 13: Flow cytometry results of the HeLa Standard plate (3rd measurement). The three standard promoters CMV, JeT, and JeT_CMV were measured 20 hours after transfection of the HeLa cells and their Relative Expression Units (REU) normalized to the JeT promoter are shown above. The standard deviations of the replicates are also shown. |
10-07-2009
- We measured the synthetic NFkB responsive promoter plate in U2-OS after 10 hours of induction again (Fig. 14).
 Figure 14: Flow cytometry results of the NFkB responsive promoters in U2-OS (2nd measurement).The U2-OS cells were transfected with the different synthetic NFkB responsive promoters coupled to GFP. After 10 hours of induction with TNF-alpha the GFP fluorescence was measured by flow cytometry. The error bars represent the standard deviation. 10-08-2009
- We measured the synthetic Estrogen responsive promoter in MCF-7. Unfortunately, the number of the viable cells are not enough for a reliable measurement.
10-09-2009
- Fourth measurement of the HeLa Standard plate (Fig. 15).
- We measured the synthetic SREBP responsive promoter in HeLa (induction with LDS). -> no successfull induction (Fig. 17).
- Second measurement of the synthetic constitutive promoters in HeLa (Fig. 16).
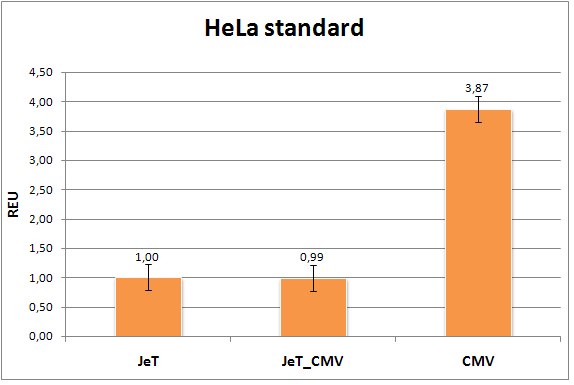 Figure 15: Flow cytometry results of the HeLa Standard plate (4th measurement). The three standard promoters CMV, JeT, and JeT_CMV were measured 20 hours after transfection of the HeLa cells and their Relative Expression Units (REU) normalized to the JeT promoter are shown above. The standard deviations of the replicates are also shown. |
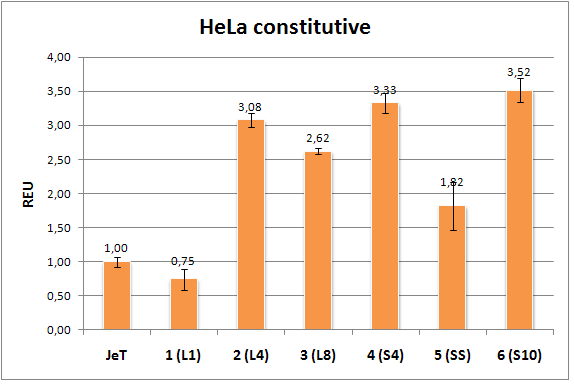 Figure 16: Flow cytometry results of the constitutive promoters in HeLa (2nd measurement).The synthesized constitutive promoters of varying strength were measured 20 hours after transfection of the HeLa cells and their Relative Expression Units (REU) normalized to the JeT promoter are shown above.The standard deviations of the replicates are also shown. |
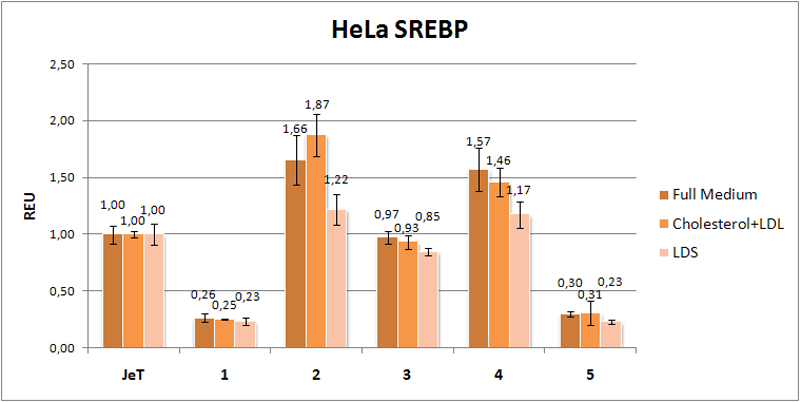 Figure 17: Flow cytometry results of the SREBP responsive promoters in HeLa (1st measurement). The HeLa cells were transfected with different synthetic SREBP responsive promoters, which are coupled to the fluorescent protein GFP. The cells were measured with flow cytometry after induction with LDS (Lipoprotein Deficient Serum), full medium and Cholesterol + LDL. The induction substance LDS should activate the SREBP promoters and Cholesterol + LDL should inactivate the promoters. The error bars present the standard deviation. |
10-11-2009
- We measured the natural promoter c-Jun (AP-1) in HeLa after induction with Epidermal Growth Factor (Fig. 18).
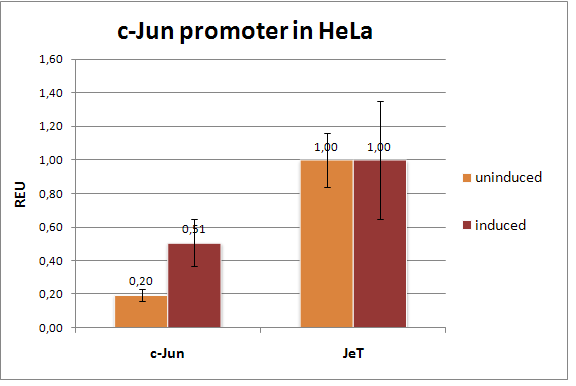 Figure 18: Flow cytometry results of the natural promoter c-Jun (AP-1). The HeLa cells were transfected with the natural c-Jun promoter coupled to the fluorescent protein GFP. The c-Jun promoter is induced by Epidermal Growth Factor (diluted 1:2000 in DMEM++) for three hours. This GFP fluorescence is measured by flow cytometry. Besides, the standard deviation is also shown. 10-12-2009
- Fifth measurement of the HeLa standard plate. Results shown below (Fig. 19).
- Crossinduction of NF-kB responsive synthetic promoter NIIL10 (Fig. 20): We measured the promosing NFkB responsive promoter NIIL10 (clone 31) in different media in U2-OS. Here, we want to see, if there is an induction of a nonspecific drug (Thiazolidinedione, 1:100 000) and how the different media affect the promoter activity. No significant change -> no influence/induction of the drug or medium.
 Figure 19: Flow cytometry results of the HeLa Standard plate (5th measurement). The three standard promoters CMV, JeT, and JeT_CMV were measured 20 hours after transfection of the HeLa cells and their Relative Expression Units (REU) normalized to the JeT promoter are shown above. The standard deviations of the replicates are also shown. |
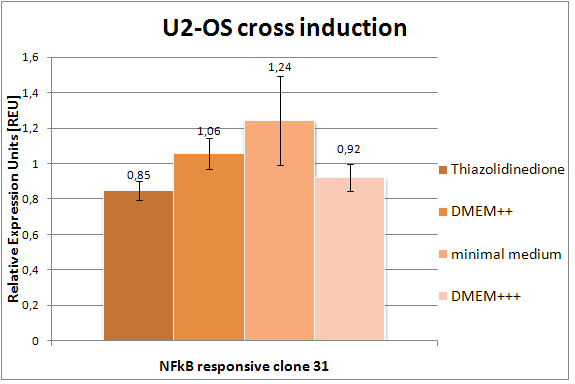 Figure 20: Flow cytometry results of the NIIL10 (clone 31) promoter (NFkB responsive promoter) under different conditions in U2-OS. The U2-OS cells were transfected with the NIIL10 promoter (also clone 31), which is coupled to GFP. After induction with Thiazolidinedione (1:100 000) and different media the cells were measured by flow cytometry. The standard deviation is also shown. |
10-13-2009
- We measured the synthetic p53 responsive promoter in MCF-7. Unfortunately, there were some problems with the flow cytometry analysis.
10-14-2009
- We measured the standard CMV promoter under different conditions (Fig. 21): full medium, minimal medium, and minimal medium + Erolimus. We wanted to check that CMV is comparable under different conditions. A fourth sample prepared at the same time will be measured after 50 hours to analyze the change of JeT and CMV over a long period of time.
- Results of the first three measurements shown below.
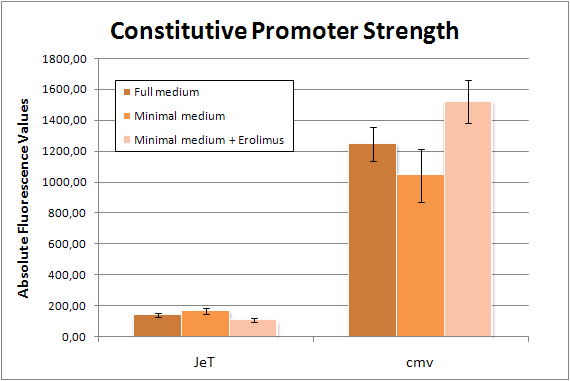 Figure 21: Flow cytometry results of the standard CMV promoter under different conditions The CMV promoter coupled to GFP was transfected into HeLa cells and its activity was tested under different conditionds: full medium, minimal medium, and minimal medium + Everolimus. The resulting GFP fluorescence were measured by flow cytometry. The standard deviations of the replicates are also shown. 10-15-2009
- We measured the MCF-7 (Fig. 22) and U2-OS (Fig. 23) Standard plate (fourth measurements).
 Figure 22: Flow cytometry results of the MCF-7 Standard plate (4th measurement). The three standard promoters CMV, JeT, and JeT_CMV were measured 20 hours after transfection of the MCF-7 cells and their Relative Expression Units (REU) normalized to the JeT promoter are shown above.The standard deviations of the replicates are also shown. |
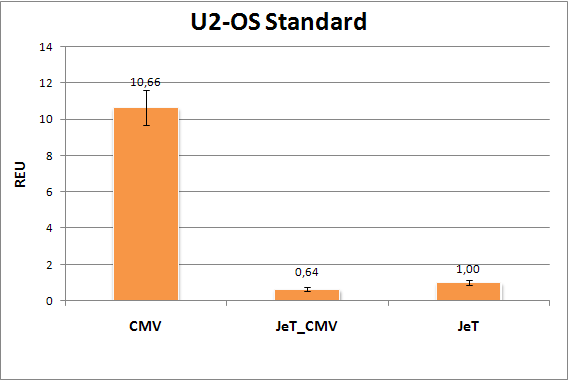 Figure 23: Flow cytometry results of the U2-OS Standard plate (4th measurement). The three standard promoters CMV, JeT, and JeT_CMV were measured 20 hours after transfection of the U2-OS cells and their Relative Expression Units (REU) normalized to the JeT promoter are shown above.The standard deviations of the replicates are also shown. |
- We measured a second timepoint (after 50 hours) of the CMV promoter and added these results in the figure 21 (new figure 24, below). To check, if the GFP fluorescence changed after 50 hours.
- Third measurement of NIIL10 (NFkb responsive) in U2-OS (Fig. 25).
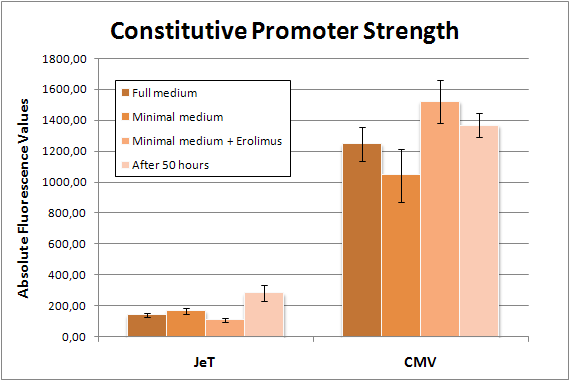 Figure 24: Flow cytometry results of the standard CMV promoter under different conditions and time periods. The CMV promoter coupled to GFP was transfected into HeLa cells and its activity was tested under different conditionds: full medium, minimal medium, and minimal medium + Erolimus. Besides, its activity is measured after 50 hours by flow cytometry. The standard deviations of the replicates are also shown. |
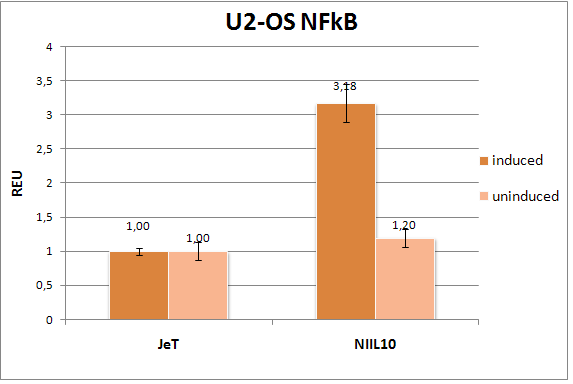 Figure 25: Flow cytometry results of the synthetic NFkB responsive promoters in U2-OS (3nd measurement). The U2-OS cells were transfected with the NIIL10 promoter (also clone 31), which is coupled to GFP. After induction with TNF-alpha (10 hours) the cells were measured by flow cytometry. The standard deviations of the replicates are also shown. |
|
 "
"


