Notebook Microscopy
Contents
8-28-2009
- Fixing cells with 4% Formaldehyde for microscopy on monday.
8-31-2009
- Microscopy of our first fixed cells transfected with various constructs at the Nikon imaging center
- Cells transfected with cmv-GFP, jet-GFP, cmv-jet-GFP
- The figure below shows HeLa cells transfected with GFP under a cmv promoter. The image was taken using the Nikon Eclipse 90i upright automated widefield microscope with 40X magnification:
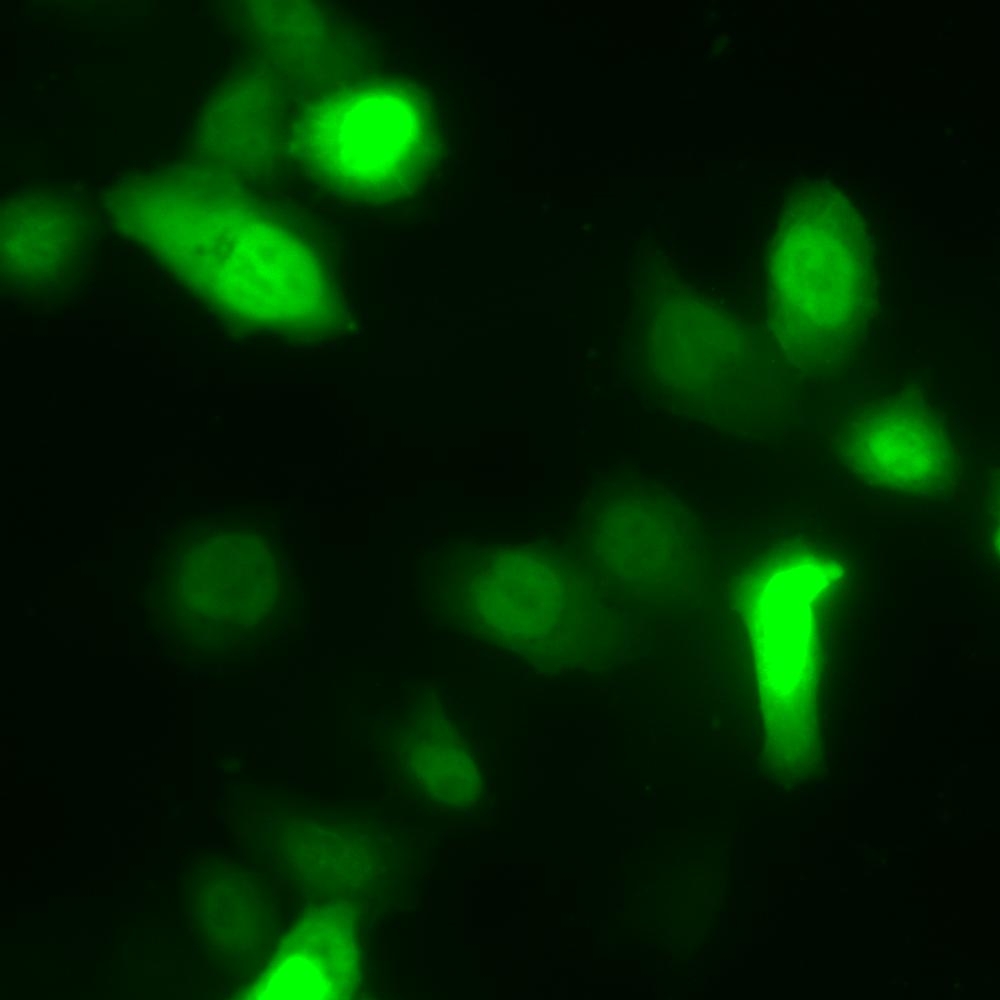 Figure 1: HeLa cells transfected with CMV in front of GFP. Image taken with 40x magification. 9-02-2009
- Microscopy of cells transfected with cmv, jet, cmv-jet with GFP and an mCherry control
- Measurement of exposure time versus average grey value to check whether there is a linear correlation between the two. This measurement was performed using a fluorescent slide that has constant fluorescence and doesn't bleach. The correlation factor was calculated to be 0.9998. Therefore we can calculate the grey values of samples with different exposure times.
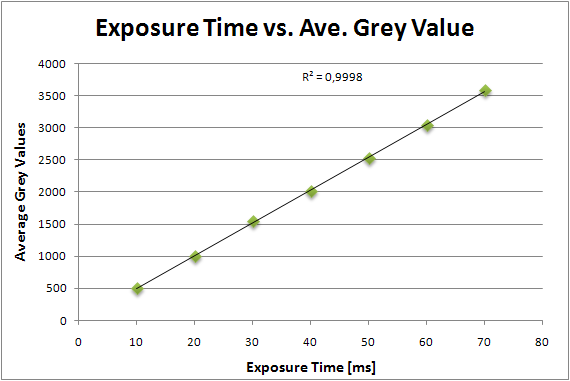 Figure 2: Graph of exposure time versus average grey values The correlation factor is indicated on the diagram. 9-05-2009
- Test the bleaching effect of our GFP by exciting it over 10 minutes and taking images every 10 seconds. The images were evaluated for their fluorescence intensities using the imaging software NTS Elements-3.1. The data is shown in the diagram below.
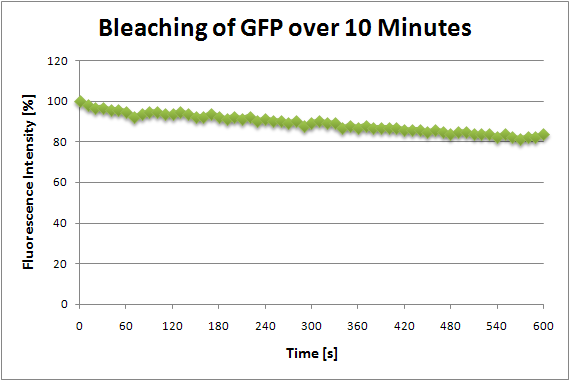 Figure 3: Bleaching of GFP. This diagram shows the percent fluorescence intensity versus time of our GFP. The initial fluorescence intensity was set to 100% The correlation factor is indicated on the diagram. 9-06-2009
- Fixing cells with 4% formaldehyde for standard promoters JeT, JeT-CMV and CMV in HeLa. HeLa cells were cotransected with a plasmid containing JeT in front of mCherry as a reference in a 2:1 GFP: mCherry ratio.
9-07-2009
- Imaging of HeLa with three standard promoters, example image shown below.
- Image analysis using ImageJ.
 Figure 4: HeLa cells co-transfected with cmv-GFP and JeT mCherry both fluorescence proteins are localized to the plasma membrane. Images were acquired using 20x magnification on a widefield microscope.
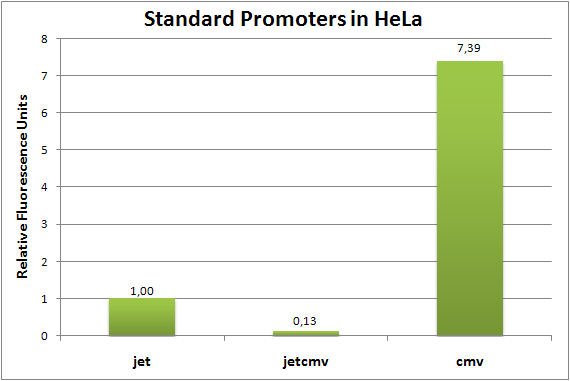 Figure 5: Graph of exposure time versus average grey values Mean grey values were obtained using ImageJ analysis of 20x widefield microscopy images. The promoter strength is given relative to our standard promoter JeT. Mean grey values were adjusted according to their exposure time. 9-09-2009
- Fix MCF7 cells for standard measurement.
9-10-2009
- Imaging and analysis of MCF-7 with JeT, JeT-CMV and CMV.
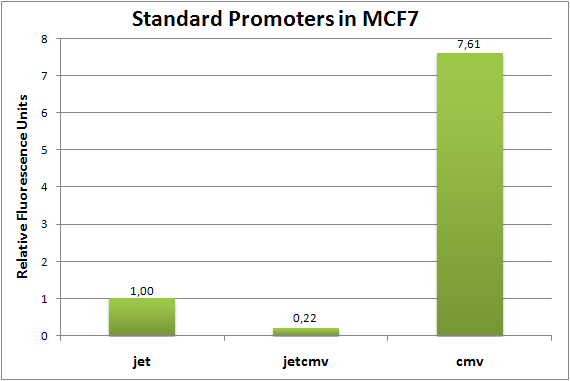 Figure 6: REUs of standard promoters in MCF7 Mean grey values were obtained using ImageJ analysis of 20x widefield microscopy images. The promoter strength is given relative to our standard promoter JeT. Mean grey values were adjusted according to their exposure time. 9-15-2009
- Fix MCF-7 cells for testing constitutive promoter L4 and S4
9-16-2009
- Imaging and analysis using ImageJ
 Figure 7: Relatuve Expression Units of constitutive promoters L4 and S4 compared to standrad promoters JeT-CMV and CMV. Mean grey values were obtained using ImageJ analysis of 20x widefield microscopy images. Grey values were adjusted according to their exposure time. 9-20-2009
- Fix HeLa and U2OS cells for testing constitutive promoters S5, S10, S16, L1, L8 and JeT as reference.
9-21-2009
- Imaging and Analysis of fixed HeLa with constitutive promoters.
- U2OS cell were mostly dead, samples were not measured.
 Figure 8: REUs of constitutive promoters in HeLa. Mean grey values were obtained using ImageJ analysis of 20x widefield microscopy images. The promoter strength is given relative to our standard promoter JeT. Mean grey values were adjusted according to their exposure time. 10-05-2009
- Fixing U2-OS cells transfected with NF-kB clone 31 inducible synthetic promoter at three different time points. Cells were induced at 7:30 am. Cells were fixed after 3, 7 and 10 hours.
10-06-2009
- Imaging and ImageJ analysis of three time-points measurement of induced and uninduced NF-kB clone 31 with P31 (induced and uninduced) as a reference.
- Microscopy of plasma membrane targeted GFP (Figure 10).
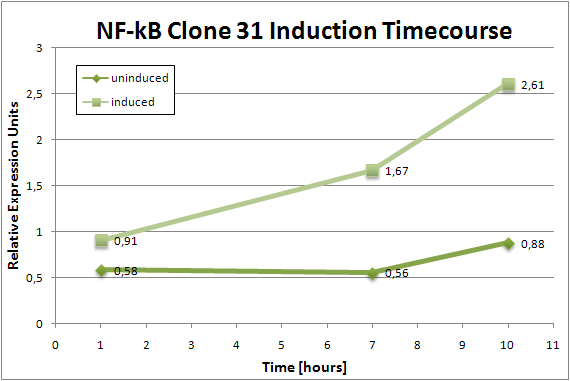 Figure 9: REUs of NIIL10 promoter at three time-points in U2-OS U2-OS cells were transfected and fixed after 1, 7 and 10 hours, fixed and measrued the next day. Fluorescence intensity relative to JeT were obtained using image analysis software ImageJ. 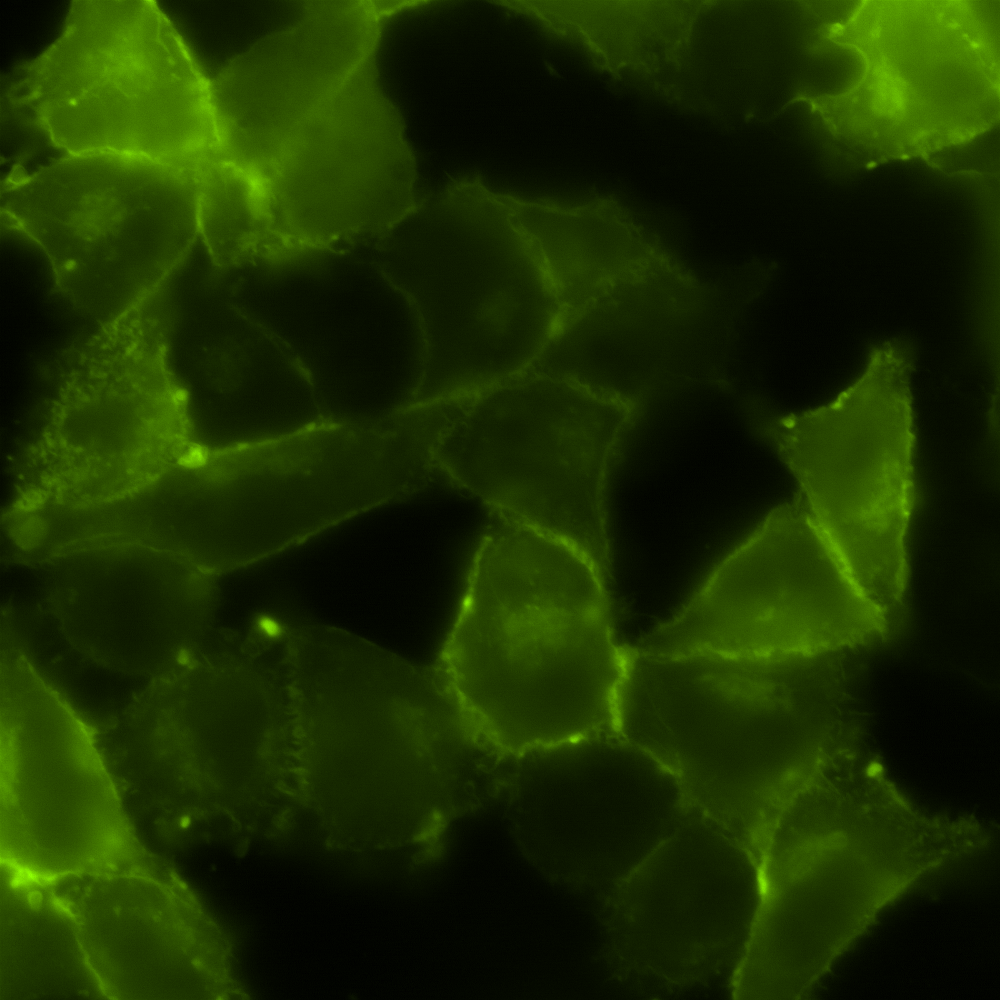 Figure 10: Plasma membrane targeted GFP. Widefield microscopy image of plasma membrane targeted GFP with 40x magnification. 10-12-2009
- Fixing of U2-OS for standard measurement with CMV, JeT and JeT-CMV and the mCherry reference plasmid.
10-13-2009
- Imaging of U2OS standards. The exposure times for CMV, JeT and JeT-CMV were 10 ms, 60 ms and 100 ms.
- Image analysis using imageJ was used to measure the flourescence strength. The mean grey values were all normalized to an exposure time of 100ms and the ratio relative to JeT was determined to be: 10.1: 1.0: 0.66 for CMV: JeT :JeT-CMV.
10-21-2009
- Imaging of p5_mCHerry_PM
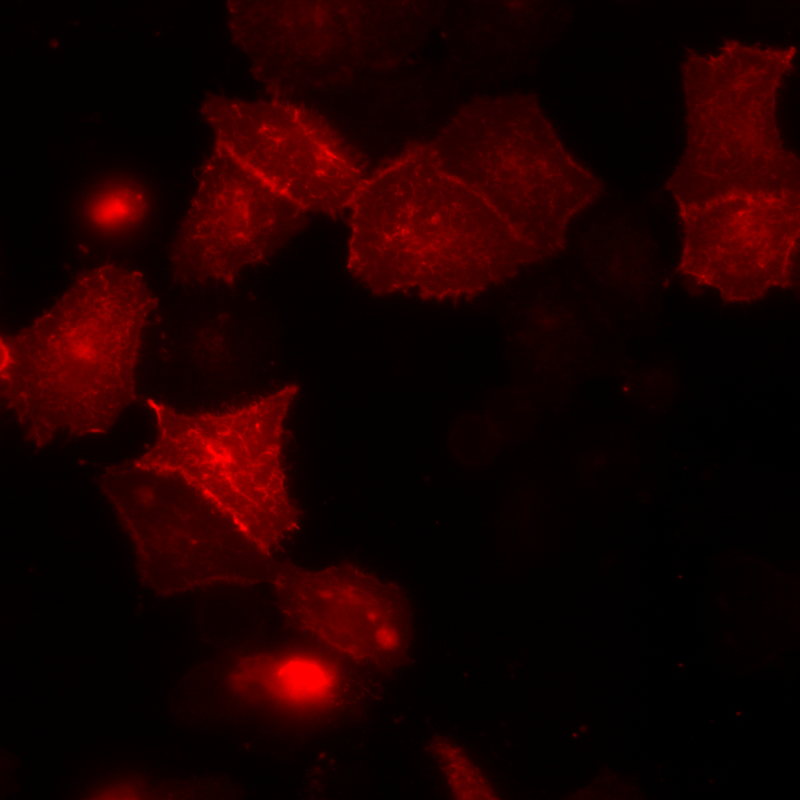 Figure 11: HeLa cells transfected with p5_mCHerry_PM. Imaged 24 h after transfection
|
 "
"


