 "
"
Team:EPF-Lausanne/Analysis methods
From 2009.igem.org
(New page: {{EPF-Lausanne09}} <div CLASS="epfltrick">__TOC__ </div><div CLASS="epfl09"> <html><center> <font size="6" color="#007CBC"><i>Analysis Methods</i></font> </center></html> <br> ---- <br>...) |
(→Generating input files) |
||
| (234 intermediate revisions not shown) | |||
| Line 1: | Line 1: | ||
{{EPF-Lausanne09}} | {{EPF-Lausanne09}} | ||
<div CLASS="epfltrick">__TOC__ | <div CLASS="epfltrick">__TOC__ | ||
| - | </div><div CLASS=" | + | </div><div CLASS="epfl09model"> |
| + | |||
| + | <html><br> | ||
| + | <br> | ||
| + | <br> | ||
| + | <br><center> | ||
| + | |||
| + | <a href="https://2009.igem.org/Team:EPF-Lausanne/Modeling_overview" onMouseOver="document.MyImage7.src='https://static.igem.org/mediawiki/2009/8/83/Modeling_overview.jpg';" onMouseOut="document.MyImage7.src='https://static.igem.org/mediawiki/2009/6/6d/Modeling_overview_grey.jpg';"> | ||
| + | <img src="https://static.igem.org/mediawiki/2009/6/6d/Modeling_overview_grey.jpg" name="MyImage7"></a> | ||
| + | |||
| + | |||
| + | | ||
| + | |||
| + | |||
| + | <a href="https://2009.igem.org/Team:EPF-Lausanne/Analysis_methods" onMouseOver="document.MyImage4.src='https://static.igem.org/mediawiki/2009/thumb/6/6e/An_meth.png/150px-An_meth.png';" onMouseOut="document.MyImage4.src='https://static.igem.org/mediawiki/2009/thumb/6/6e/An_meth.png/150px-An_meth.png';"> | ||
| + | <img src="https://static.igem.org/mediawiki/2009/thumb/6/6e/An_meth.png/150px-An_meth.png" name="MyImage4"></a> | ||
| + | |||
| + | |||
| + | | ||
| + | |||
| + | <a href="https://2009.igem.org/Team:EPF-Lausanne/Results" onMouseOver="document.MyImage6.src='https://static.igem.org/mediawiki/2009/thumb/2/2f/Results.jpg/150px-Results.jpg';" onMouseOut="document.MyImage6.src='https://static.igem.org/mediawiki/2009/thumb/4/43/Results_nb.jpg/150px-Results_nb.jpg';"> | ||
| + | <img src="https://static.igem.org/mediawiki/2009/thumb/4/43/Results_nb.jpg/150px-Results_nb.jpg" name="MyImage6"></a> | ||
| + | |||
| + | |||
| + | | ||
| + | |||
| + | |||
| + | <a href="https://2009.igem.org/Team:EPF-Lausanne/Information_&_references" onMouseOver="document.MyImage5.src='https://static.igem.org/mediawiki/2009/thumb/a/a2/Ref.jpg/150px-Ref.jpg';" onMouseOut="document.MyImage5.src='https://static.igem.org/mediawiki/2009/thumb/2/25/Ref_nb.jpg/150px-Ref_nb.jpg';"> | ||
| + | <img src="https://static.igem.org/mediawiki/2009/thumb/2/25/Ref_nb.jpg/150px-Ref_nb.jpg" name="MyImage5"></a> | ||
| + | |||
| + | |||
| + | </center> | ||
| + | </html> | ||
| + | <br> | ||
| + | ---- | ||
| + | <br><br> | ||
<html><center> | <html><center> | ||
| - | <font size=" | + | <font size="12" color="#007CBC">Analysis Methods</font> |
</center></html> | </center></html> | ||
<br> | <br> | ||
---- | ---- | ||
<br> | <br> | ||
| + | |||
| + | =Softwares used= | ||
| + | ===VMD=== | ||
| + | VMD is a molecular visualization program for displaying, animating, and analyzing biomolecular systems using 3-D graphics and built-in scripting. It provides a wide range of molecular representations, and includes tools for working with volumetric data, sequence data, and arbitrary graphics objects. You can have more information on their [http://www.ks.uiuc.edu/Research/vmd/ webpage]. | ||
<br> | <br> | ||
| + | ===NAMD=== | ||
| + | NAMD is a molecular dynamics code designed for simulation of large biomolecular systems. It is based on Charm++ parallel programming model, and uses VMD for simulation setup and trajectory analysis. | ||
| + | See their website [http://www.ks.uiuc.edu/Research/namd/ here]. | ||
| - | = | + | <br><br> |
| - | <br> | + | |
| + | =Information needed= | ||
| + | ===Generating input files=== | ||
| + | In this section, we explain all the steps to create needed files for NAMD, except the .conf file, which is just [https://2009.igem.org/Team:EPF-Lausanne/Analysis_methods#Namd_.conf_parameters below]. | ||
| + | We need a compatible .pdb in addition to parameter and topology files to go through. Steps to generate all the input files are explained in detail on this page: | ||
| + | [[Team:EPF-Lausanne/Modeling/Simulation|How to generate input files]]. This is a kind of summary of the tutorial. | ||
| + | |||
| + | ===Launch a simulation=== | ||
| + | We start from .pdb, .psf, .rtf generated in the previous sections and we explain how to launch NAMD on both clusters we have access to. Complete process is on a separate page [[Team:EPF-Lausanne/Modeling/RunSimulation|How to launch a simulation]]. | ||
| + | |||
| + | ===Namd .conf parameters=== | ||
| + | Namd can run different kind of simulations, from minimization to MD simulations. Here are the .conf file we used. [[Team:EPF-Lausanne/Modeling/NamdConf|NamdConf]] | ||
| + | |||
| + | ===Scripts used=== | ||
| + | We stored all our scripts, which were highly modified compared to the original ones, in order to fit our needs. You can find them on [https://2009.igem.org/Team:EPF-Lausanne/Scripts this page]. | ||
| + | |||
| + | <br><br> | ||
| + | |||
| + | =Step by step analysis= | ||
| + | The following section is a kind of tutorial, which describes step by step how to obtain our different results. | ||
| + | |||
| + | This analysis will check whether the minimization, the heating and the equilibration took place correctly and whether the protein did not explode. | ||
| + | |||
| + | {|class="wikitable" border="0" cellpadding="10" cellspacing="1" style="padding: 1px; background-color:#007CBC; text-align:center" | ||
| + | !align="left" valign="top" style="background:#ffffff;" | | ||
== Maxwell-Boltzmann Energy Distribution == | == Maxwell-Boltzmann Energy Distribution == | ||
| + | Here we will confirm that the kinetic energy distribution of the atoms in a system corresponds to the Maxwell distribution for a given temperature. | ||
<html> | <html> | ||
<script type="text/javascript" language="JavaScript"><!-- | <script type="text/javascript" language="JavaScript"><!-- | ||
| Line 30: | Line 97: | ||
} | } | ||
//--></script> | //--></script> | ||
| - | |||
<p> | <p> | ||
| - | <a href="javascript:ReverseDisplay('hs1')"> Click here to | + | <a href="javascript:ReverseDisplay('hs1')"> Click here to expand</a> |
</p> | </p> | ||
| - | |||
<div id="hs1" style="display:none;"> | <div id="hs1" style="display:none;"> | ||
<p> | <p> | ||
| - | + | <br> | |
| - | + | ||
<b>1.</b> In VMD, load the <i>.psf file</i>. Browse for the restart velocity file (in our case, it was <i>2v0w_hydr_wb_i_eq.restart.vel</i>), the type of file need this time to be selected. In the Determine file type: pull-down menu, choose NAMD Binary Coordinates, and load again. | <b>1.</b> In VMD, load the <i>.psf file</i>. Browse for the restart velocity file (in our case, it was <i>2v0w_hydr_wb_i_eq.restart.vel</i>), the type of file need this time to be selected. In the Determine file type: pull-down menu, choose NAMD Binary Coordinates, and load again. | ||
<br> | <br> | ||
| Line 87: | Line 151: | ||
<br>Click on the Apply button. This will open a window with the new value for a0, as well as some statistical measures, including the Correlation Coefficient, which is a measure of the fit. | <br>Click on the Apply button. This will open a window with the new value for a0, as well as some statistical measures, including the Correlation Coefficient, which is a measure of the fit. | ||
<br><center><img src="https://static.igem.org/mediawiki/2009/thumb/9/92/Correlation_coefficient.jpg/350px-Correlation_coefficient.jpg"></center> | <br><center><img src="https://static.igem.org/mediawiki/2009/thumb/9/92/Correlation_coefficient.jpg/350px-Correlation_coefficient.jpg"></center> | ||
| - | <br>The value of | + | <br>The value of a<sub>0</sub> obtained corresponds to k<sub>B</sub>T . Obtain the temperature T for this distribution with k<sub>B</sub> = 0.00198657 kcal |
/mol /K. | /mol /K. | ||
| - | |||
| - | |||
| - | |||
<br> | <br> | ||
| - | |||
| - | |||
| - | |||
| - | |||
| - | |||
| - | |||
| - | |||
| - | |||
| - | |||
| - | |||
| - | |||
| - | |||
| - | |||
| - | |||
| - | |||
| - | |||
| - | |||
| - | |||
| - | |||
| - | |||
| - | |||
| - | |||
| - | |||
| - | |||
| - | |||
| - | |||
| - | |||
| - | |||
| - | |||
| - | |||
| - | |||
| - | |||
| - | |||
| - | |||
| - | |||
| - | |||
</p> | </p> | ||
</div> | </div> | ||
</html> | </html> | ||
| + | |} | ||
<br> | <br> | ||
| + | |||
| + | {|class="wikitable" border="0" cellpadding="10" cellspacing="1" style="padding: 1px; background-color:#007CBC; text-align:center" | ||
| + | !width="20%" align="left" valign="top" style="background:#ffffff; color:black"| | ||
== Energies == | == Energies == | ||
| + | Here we will calculate the average of various energies such as kinetic energy and different internal ones so called bonded energies (bonds, | ||
| + | angles and dihedrals). Moreover, we will calculate non-bonded energy (electrostatic, van der Waals)) over the course of the equilibration. | ||
<html> | <html> | ||
<script type="text/javascript" language="JavaScript"><!-- | <script type="text/javascript" language="JavaScript"><!-- | ||
| Line 153: | Line 184: | ||
<p> | <p> | ||
| - | <a href="javascript:ReverseDisplay('hs2')"> Click here to | + | <a href="javascript:ReverseDisplay('hs2')"> Click here to expand</a> |
</p> | </p> | ||
<div id="hs2" style="display:none;"> | <div id="hs2" style="display:none;"> | ||
<p> | <p> | ||
| - | + | <b>1.</b> We start with a file obtained from NAMD: <br>http://www.ks.uiuc.edu/Research/namd/utilities/ and download <i> namdstats.tcl </i> | |
| - | + | ||
| - | + | ||
| - | <b>1.</b> We start with a file obtained from NAMD: <br>http://www.ks.uiuc.edu/Research/namd/utilities/ and download <i> | + | |
<br><br> | <br><br> | ||
<b>2.</b> In the VMD TkCon window, type : | <b>2.</b> In the VMD TkCon window, type : | ||
| Line 170: | Line 198: | ||
</div> | </div> | ||
</html> | </html> | ||
| + | |} | ||
<br> | <br> | ||
| + | |||
| + | {|class="wikitable" border="0" cellpadding="10" cellspacing="1" style="padding: 1px; background-color:#007CBC; text-align:center" | ||
| + | !width="20%" align="left" valign="top" style="background:#ffffff; color:black"| | ||
== Temperature distribution == | == Temperature distribution == | ||
| + | Here we will analyze the temperature distribution over the simulation. The temperature might increase linearly during the heating step and then it might remain stable. | ||
| + | |||
| + | We obtained the expected [https://2009.igem.org/wiki/index.php?title=Team:EPF-Lausanne/Results/Validation#Temperature results]. | ||
| + | <br> | ||
<html> | <html> | ||
<script type="text/javascript" language="JavaScript"><!-- | <script type="text/javascript" language="JavaScript"><!-- | ||
| Line 189: | Line 225: | ||
<p> | <p> | ||
| - | <a href="javascript:ReverseDisplay('hs3')"> Click here to | + | <a href="javascript:ReverseDisplay('hs3')"> Click here to expand</a> |
</p> | </p> | ||
| Line 195: | Line 231: | ||
<p> | <p> | ||
| - | |||
| - | |||
<br>In order to obtain the data for the temperature from the log file we will again use the script <i>namdstats.tcl</i>, which was already sourced. Type in a terminal window: | <br>In order to obtain the data for the temperature from the log file we will again use the script <i>namdstats.tcl</i>, which was already sourced. Type in a terminal window: | ||
<br><span style="font-family: Courier;"> data_time TEMP namd_log </span> | <br><span style="font-family: Courier;"> data_time TEMP namd_log </span> | ||
<br>It will store each timestep and its corresponding temperature in the file TEMP.dat. | <br>It will store each timestep and its corresponding temperature in the file TEMP.dat. | ||
<br><br> | <br><br> | ||
| - | |||
| - | |||
| - | |||
| - | |||
| - | |||
| - | |||
| - | |||
| - | |||
| - | |||
| - | |||
| - | |||
| - | |||
| - | |||
| - | |||
| - | |||
| - | |||
| - | |||
| - | |||
| - | |||
| - | |||
| - | |||
| - | |||
| - | |||
| - | |||
| - | |||
| - | |||
| - | |||
| - | |||
| - | |||
| - | |||
| - | |||
| - | |||
| - | |||
| - | |||
| - | |||
| - | |||
</p> | </p> | ||
</div> | </div> | ||
</html> | </html> | ||
| + | |} | ||
<br> | <br> | ||
| + | |||
| + | {|class="wikitable" border="0" cellpadding="10" cellspacing="1" style="padding: 1px; background-color:#007CBC; text-align:center" | ||
| + | !width="20%" align="left" valign="top" style="background:#ffffff; color:black"| | ||
== Density == | == Density == | ||
| + | Here we will analyze the behavior of the protein density over the simulation. Normally during the equilibration step density might remain more or less stable. Particularly during the NVT equilibration the density might remain constant. | ||
| + | We obtained the expected [https://2009.igem.org/wiki/index.php?title=Team:EPF-Lausanne/Results/Validation#Density results]. | ||
<html> | <html> | ||
<script type="text/javascript" language="JavaScript"><!-- | <script type="text/javascript" language="JavaScript"><!-- | ||
| Line 260: | Line 264: | ||
<p> | <p> | ||
| - | <a href="javascript:ReverseDisplay('hs4')"> Click here to | + | <a href="javascript:ReverseDisplay('hs4')"> Click here to expand</a> |
</p> | </p> | ||
| Line 266: | Line 270: | ||
<p> | <p> | ||
| - | In order to obtain the data for the volume from the log file we will again use the script | + | In order to obtain the data for the volume from the log file we will again use the script <i>namdstats.tcl</i>, which was already sourced. Type in a terminal window: |
<br><span style="font-family: Courier;"> data_time VOLUME namd_log </span> | <br><span style="font-family: Courier;"> data_time VOLUME namd_log </span> | ||
| - | <br>It will store each timestep and its corresponding | + | <br>It will store each timestep and its corresponding volume in the file VOLUME.dat. |
<br><br> | <br><br> | ||
| - | |||
| - | |||
| - | |||
| - | |||
| - | |||
| - | |||
| - | |||
| - | |||
| - | |||
| - | |||
| - | |||
| - | |||
| - | |||
| - | |||
| - | |||
| - | |||
| - | |||
| - | |||
| - | |||
| - | |||
| - | |||
| - | |||
| - | |||
| - | |||
| - | |||
| - | |||
| - | |||
| - | |||
| - | |||
| - | |||
| - | |||
| - | |||
| - | |||
| - | |||
</p> | </p> | ||
</div> | </div> | ||
</html> | </html> | ||
| + | |} | ||
<br> | <br> | ||
| + | |||
| + | {|class="wikitable" border="0" cellpadding="10" cellspacing="1" style="padding: 1px; background-color:#007CBC; text-align:center" | ||
| + | !width="20%" align="left" valign="top" style="background:#ffffff; color:black"| | ||
== Pressure as a function of simulation time == | == Pressure as a function of simulation time == | ||
| + | Here we will analyze the pressure behavior along the minimization and the equilibration. This quantity might stabilize after the heating and remain more or less stable during the equilibration. Particularly during the NPT steps the pressure might be strictly constant. | ||
| + | |||
| + | We obtained the expected [https://2009.igem.org/wiki/index.php?title=Team:EPF-Lausanne/Results/Validation#Pressure results]. | ||
<html> | <html> | ||
<script type="text/javascript" language="JavaScript"><!-- | <script type="text/javascript" language="JavaScript"><!-- | ||
| Line 328: | Line 305: | ||
<p> | <p> | ||
| - | <a href="javascript:ReverseDisplay('hs5')"> Click here to | + | <a href="javascript:ReverseDisplay('hs5')"> Click here to expand</a> |
</p> | </p> | ||
| Line 346: | Line 323: | ||
So, to extract pressure from our first simulation, the command is: data_time PRESSURE namd_log | So, to extract pressure from our first simulation, the command is: data_time PRESSURE namd_log | ||
<br><br> | <br><br> | ||
| - | |||
| - | |||
| - | |||
| - | |||
| - | |||
| - | |||
| - | |||
| - | |||
| - | |||
| - | |||
| - | |||
| - | |||
| - | |||
| - | |||
| - | |||
| - | |||
| - | |||
| - | |||
| - | |||
| - | |||
| - | |||
| - | |||
| - | |||
| - | |||
| - | |||
| - | |||
| - | |||
| - | |||
| - | |||
| - | |||
| - | |||
| - | |||
| - | |||
| - | |||
</p> | </p> | ||
</div> | </div> | ||
</html> | </html> | ||
| + | |} | ||
<br> | <br> | ||
| + | |||
| + | {|class="wikitable" border="0" cellpadding="10" cellspacing="1" style="padding: 1px; background-color:#007CBC; text-align:center" | ||
| + | !width="20%" align="left" valign="top" style="background:#E5E9FF; color:black"| | ||
==RMSD for individual residues== | ==RMSD for individual residues== | ||
| + | Here we will calculate the RMSD for each residue to determine which residue move the most. This analysis will help us to see which residue is more or less stable. | ||
| + | After that we will try after that to select the amino acids to mutate in order to stabilize the light activated state of our LOV domain. | ||
| + | |||
| + | Click [https://2009.igem.org/wiki/index.php?title=Team:EPF-Lausanne/Results/Validation#RMSD here] to see the results. | ||
<html> | <html> | ||
<script type="text/javascript" language="JavaScript"><!-- | <script type="text/javascript" language="JavaScript"><!-- | ||
| Line 403: | Line 354: | ||
<p> | <p> | ||
| - | <a href="javascript:ReverseDisplay('hs6')"> Click here to | + | <a href="javascript:ReverseDisplay('hs6')"> Click here to expand</a> |
</p> | </p> | ||
| Line 420: | Line 371: | ||
<br><br> | <br><br> | ||
<b>3.</b> Now we will calculate the RMSD values of all atoms in the newly created selection: | <b>3.</b> Now we will calculate the RMSD values of all atoms in the newly created selection: | ||
| - | <br><span style="font-family: Courier;"> rmsd_residue_over_time top $ | + | <br><span style="font-family: Courier;"> rmsd_residue_over_time top $sel_resid </span> |
<br>At the end of the calculation, we have a list of the avergae RMSD per residue (in the file residue_rmsd.dat) | <br>At the end of the calculation, we have a list of the avergae RMSD per residue (in the file residue_rmsd.dat) | ||
<br> | <br> | ||
| Line 442: | Line 393: | ||
<b>5.</b> Now we can plot the RMSD value per residue by typing in a Terminal window : | <b>5.</b> Now we can plot the RMSD value per residue by typing in a Terminal window : | ||
<br><span style="font-family: Courier;"> xmgrace residue rmsd.dat </span> | <br><span style="font-family: Courier;"> xmgrace residue rmsd.dat </span> | ||
| - | |||
| - | |||
| - | |||
| - | |||
| - | |||
| - | |||
| - | |||
| - | |||
| - | |||
| - | |||
| - | |||
| - | |||
| - | |||
| - | |||
| - | |||
| - | |||
| - | |||
| - | |||
| - | |||
| - | |||
| - | |||
| - | |||
| - | |||
| - | |||
| - | |||
| - | |||
| - | |||
| - | |||
| - | |||
| - | |||
| - | |||
| - | |||
| - | |||
| - | |||
| - | |||
| - | |||
| - | |||
| - | |||
| - | |||
| - | |||
| - | |||
| - | |||
| - | |||
| - | |||
| - | |||
| - | |||
| - | |||
| - | |||
| - | |||
| - | |||
| - | |||
| - | |||
| - | |||
| - | |||
| - | |||
</p> | </p> | ||
</div> | </div> | ||
</html> | </html> | ||
| + | |} | ||
<br> | <br> | ||
| + | |||
| + | {|class="wikitable" border="0" cellpadding="10" cellspacing="1" style="padding: 1px; background-color:#007CBC; text-align:center" | ||
| + | !width="20%" align="left" valign="top" style="background:#E5E9FF; color:black"| | ||
== RMSD of selected atoms compared to initial position along time == | == RMSD of selected atoms compared to initial position along time == | ||
| + | |||
| + | Here we will analyze the RMSD of each atom to check whether the protein remains more or less stable during the equilibration. | ||
| + | |||
| + | Click [https://2009.igem.org/wiki/index.php?title=Team:EPF-Lausanne/Results/EDS#RMSD here] to see the results for the dark state simulation. | ||
| + | |||
| + | Click [https://2009.igem.org/Team:EPF-Lausanne/Results/ELS#RMSD here] to see the results for the light state simulation. | ||
<html> | <html> | ||
| Line 519: | Line 425: | ||
} | } | ||
//--></script> | //--></script> | ||
| - | |||
<p> | <p> | ||
| - | <a href="javascript:ReverseDisplay('hs7')"> Click here to | + | <a href="javascript:ReverseDisplay('hs7')"> Click here to expand</a> |
</p> | </p> | ||
| Line 560: | Line 465: | ||
</ul> | </ul> | ||
<br><br> | <br><br> | ||
| - | |||
| - | |||
| - | |||
| - | |||
| - | |||
| - | |||
| - | |||
| - | |||
| - | |||
| - | |||
| - | |||
| - | |||
| - | |||
| - | |||
| - | |||
| - | |||
| - | |||
| - | |||
| - | |||
| - | |||
| - | |||
| - | |||
| - | |||
| - | |||
| - | |||
| - | |||
| - | |||
| - | |||
| - | |||
| - | |||
| - | |||
| - | |||
| - | |||
| - | |||
| - | |||
| - | |||
| - | |||
| - | |||
| - | |||
| - | |||
| - | |||
| - | |||
| - | |||
| - | |||
| - | |||
| - | |||
| - | |||
| - | |||
</p> | </p> | ||
</div> | </div> | ||
</html> | </html> | ||
| + | |} | ||
<br> | <br> | ||
| + | {|class="wikitable" border="0" cellpadding="10" cellspacing="1" style="padding: 1px; background-color:#007CBC; text-align:center" | ||
| + | !width="20%" align="left" valign="top" style="background:#ffffff; color:black"| | ||
==Salt bridges== | ==Salt bridges== | ||
| + | |||
| + | Salt bridges are non-bonded interactions between charged residues. | ||
| + | |||
| + | Here we will analyze the evolution of these interactions over the equilibration in order to check how these interactions change over the equilibration. | ||
| + | |||
| + | Click [https://2009.igem.org/wiki/index.php?title=Team:EPF-Lausanne/Results/Validation#Salt_bridges here] to see the results. | ||
| + | |||
<html> | <html> | ||
<script type="text/javascript" language="JavaScript"><!-- | <script type="text/javascript" language="JavaScript"><!-- | ||
| Line 630: | Line 497: | ||
<p> | <p> | ||
| - | <a href="javascript:ReverseDisplay('hs8')"> Click here to | + | <a href="javascript:ReverseDisplay('hs8')"> Click here to expand</a> |
</p> | </p> | ||
| Line 652: | Line 519: | ||
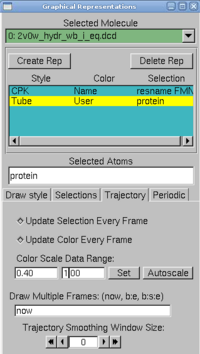
<br> <b>FMN450-ARG467</b></span> | <br> <b>FMN450-ARG467</b></span> | ||
<br><br> | <br><br> | ||
| - | |||
| - | |||
| - | |||
| - | |||
| - | |||
| - | |||
| - | |||
| - | |||
| - | |||
| - | |||
| - | |||
| - | |||
| - | |||
| - | |||
| - | |||
| - | |||
| - | |||
| - | |||
| - | |||
| - | |||
| - | |||
| - | |||
| - | |||
| - | |||
| - | |||
| - | |||
| - | |||
| - | |||
| - | |||
| - | |||
| - | |||
| - | |||
| - | |||
| - | |||
| - | |||
| - | |||
| - | |||
</p> | </p> | ||
</div> | </div> | ||
</html> | </html> | ||
| + | |} | ||
<br> | <br> | ||
| + | {|class="wikitable" border="0" cellpadding="10" cellspacing="1" style="padding: 1px; background-color:#007CBC; text-align:center" | ||
| + | !width="20%" align="left" valign="top" style="background:#e7edfd; color:black"| | ||
==RMSF== | ==RMSF== | ||
| + | |||
| + | This is quite similar to the RMSD analysis. Here we will analyze how the RMSF vary for each residues. | ||
| + | |||
| + | Click [https://2009.igem.org/Team:EPF-Lausanne/Results/EDS#RMSF here] to see the results for the dark state simulation. | ||
| + | |||
| + | Click [https://2009.igem.org/Team:EPF-Lausanne/Results/ELS#RMSF here] to see the results for the light state simulation. | ||
| + | |||
<html> | <html> | ||
<script type="text/javascript" language="JavaScript"><!-- | <script type="text/javascript" language="JavaScript"><!-- | ||
| Line 712: | Line 552: | ||
<p> | <p> | ||
| - | <a href="javascript:ReverseDisplay('hs9')"> Click here to | + | <a href="javascript:ReverseDisplay('hs9')"> Click here to expand</a> |
</p> | </p> | ||
| Line 721: | Line 561: | ||
<br><center><img src="https://static.igem.org/mediawiki/2009/4/4c/Beta_rmsf.jpg"></center> | <br><center><img src="https://static.igem.org/mediawiki/2009/4/4c/Beta_rmsf.jpg"></center> | ||
<br>If you plot beta factor and RMSF, you get such a thing. | <br>If you plot beta factor and RMSF, you get such a thing. | ||
| - | < | + | |
| + | <br> | ||
| + | </p> | ||
| + | </div> | ||
| + | </html> | ||
| + | |} | ||
<br><br> | <br><br> | ||
| - | |||
| + | {|class="wikitable" border="0" cellpadding="10" cellspacing="1" style="padding: 1px; background-color:#007CBC; text-align:center" | ||
| + | !width="20%" align="left" valign="top" style="background:#E5E9FF; color:black"| | ||
| - | + | == Angles == | |
| + | This part is made to measure the angle between two chains. The procedure is described below. | ||
| + | |||
| + | Click [https://2009.igem.org/Team:EPF-Lausanne/Results/EDS#Angle_between_beta_sheet_and_alpha_helix here] to see the results for the dark state simulation. | ||
| + | |||
| + | Click [https://2009.igem.org/Team:EPF-Lausanne/Results/ELS#Angle_between_beta_sheet_and_alpha_helix here] to see the results for the light state simulation. | ||
| + | <html> | ||
| + | <script type="text/javascript" language="JavaScript"><!-- | ||
| + | function HideContent(d) { | ||
| + | document.getElementById(d).style.display = "none"; | ||
| + | } | ||
| + | function ShowContent(d) { | ||
| + | document.getElementById(d).style.display = "block"; | ||
| + | } | ||
| + | function ReverseDisplay(d) { | ||
| + | if(document.getElementById(d).style.display == "none") { document.getElementById(d).style.display = "block"; } | ||
| + | else { document.getElementById(d).style.display = "none"; } | ||
| + | } | ||
| + | //--></script> | ||
| + | |||
| + | <p> | ||
| + | <a href="javascript:ReverseDisplay('hs10')"> Click here to expand</a> | ||
| + | </p> | ||
| + | |||
| + | <div id="hs10" style="display:none;"> | ||
| + | <p> | ||
| + | |||
| + | <ol> | ||
| + | <li> open vmd and load the trajectory </li> | ||
| + | <li> go to extensions and choose Tk console </li> | ||
| + | <li> write : <br><span style="font-family: Courier;"> source <a href="https://static.igem.org/mediawiki/2009/c/c7/Fit_angle.txt"> fit_angle.tcl </a></span></li> | ||
| + | <li> to analyse the trajectory tip the following </li> | ||
| + | <UL TYPE="disc"> | ||
| + | <li> <span style="font-family: Courier;"> sel_angle_frames 0 "resid 522 to 543 and protein" {1 0 0} </span></li> | ||
| + | <li> <span style="font-family: Courier;"> sel_sel_angle_frames 0 "resid 522 to 543 and protein" "resid 493 to 498 and protein" </span></li> | ||
| + | </UL> | ||
| + | </ol> | ||
| + | You will obtain a file called angle.dat that contains the angle between the 2 objects that you selected to calculate the angle. | ||
| + | |||
| + | </p> | ||
| + | </div> | ||
| + | </html> | ||
| + | |||
| + | |} | ||
| + | <br><br> | ||
| + | |||
| + | {|class="wikitable" border="0" cellpadding="10" cellspacing="1" style="padding: 1px; background-color:#007CBC; text-align:center" | ||
| + | !width="20%" align="left" valign="top" style="background:#E5E9FF;" | | ||
| + | |||
| + | == H bonds and distance measurments == | ||
| + | |||
| + | This part aim at finding characteristic distances, in particular for H-bonds. | ||
| + | |||
| + | Click [https://2009.igem.org/Team:EPF-Lausanne/Results/EDS#Some_useful_distances here] to see the results for the dark state simulation. | ||
| + | |||
| + | <html> | ||
| + | <script type="text/javascript" language="JavaScript"><!-- | ||
| + | function HideContent(d) { | ||
| + | document.getElementById(d).style.display = "none"; | ||
| + | } | ||
| + | function ShowContent(d) { | ||
| + | document.getElementById(d).style.display = "block"; | ||
| + | } | ||
| + | function ReverseDisplay(d) { | ||
| + | if(document.getElementById(d).style.display == "none") { document.getElementById(d).style.display = "block"; } | ||
| + | else { document.getElementById(d).style.display = "none"; } | ||
| + | } | ||
| + | //--></script> | ||
| + | <p> | ||
| + | <a href="javascript:ReverseDisplay('hs11')"> Click here to expand</a> | ||
| + | </p> | ||
| + | <div id="hs11" style="display:none;"> | ||
| + | <p> | ||
<br> | <br> | ||
| + | The Jα helix is anchored to the β structure by two H-bond networks involving: | ||
| + | <ul> | ||
| + | <li> first Lys533 (in the Jα) and the couple Glu475, Gln497 (β structure) </li> | ||
| + | <li>the second involving Lys413 (Jα) and Thr535 (β structure)</li> | ||
| + | </ul> | ||
| + | Here we explain how to plot the relevant H-bond distances (two in the former and one in the latter) for both ‘dark’ and ‘light’ state. | ||
| + | <br> | ||
| + | We first load the .psf and .dcd in VMD. Now we will consider the distance between the α carbon of Lysine 533 and of the C carbon of Glu475 and Gln497. | ||
| + | <br><br> | ||
| + | By typing in the Tk Console window : | ||
| + | <br><span style="font-family: Courier;"> set sel [atomselect top "resid 533 475 and name CA"]<br> | ||
| + | $sel get index </span> | ||
| + | <br>This gives the indices 533 and 475, and by typing in the Representations window on VMD: | ||
| + | <br><span style="font-family: Courier;"> resid 533</span> | ||
| + | <br> the Lysine in position 533 should appear. Do the same for the other residue. | ||
| + | <br> | ||
| + | Now that the two residues are visible, choose the Mouse → Label → Bonds menu item from the VMD Main menu. Click on each atom one after the other. | ||
| + | <br> | ||
| + | In VMD Main menu, select Graphics → Labels. By chosing <i>Bonds</i> we select the distance labeled. The graph tab will create a plot of the distance between these two atoms over time. | ||
| + | <br> | ||
| + | </p> | ||
| + | </div> | ||
| + | </html> | ||
| + | |} | ||
| + | <br><br> | ||
| + | |||
| + | {|class="wikitable" border="0" cellpadding="10" cellspacing="1" style="padding: 1px; background-color:#007CBC; text-align:center" | ||
| + | !width="20%" align="left" valign="top" style="background:#E5E9FF;" | | ||
| + | |||
| + | == Dihedral angles == | ||
| + | |||
| + | Dihedral angles measure angle between four atoms. | ||
| + | |||
| + | Click [https://2009.igem.org/Team:EPF-Lausanne/Results/EDS#CYS450_-_FMN here] to see the results for the dark state simulation. | ||
| + | |||
| + | Click [https://2009.igem.org/Team:EPF-Lausanne/Results/ELS#CYS450_-_FMN here] to see the results for the light state simulation. | ||
| + | |||
| + | <html> | ||
| + | <script type="text/javascript" language="JavaScript"><!-- | ||
| + | function HideContent(d) { | ||
| + | document.getElementById(d).style.display = "none"; | ||
| + | } | ||
| + | function ShowContent(d) { | ||
| + | document.getElementById(d).style.display = "block"; | ||
| + | } | ||
| + | function ReverseDisplay(d) { | ||
| + | if(document.getElementById(d).style.display == "none") { document.getElementById(d).style.display = "block"; } | ||
| + | else { document.getElementById(d).style.display = "none"; } | ||
| + | } | ||
| + | //--></script> | ||
| + | <p> | ||
| + | <a href="javascript:ReverseDisplay('hs13')"> Click here to expand</a> | ||
| + | </p> | ||
| + | <div id="hs13" style="display:none;"> | ||
| + | <p> | ||
| + | <br> | ||
| + | |||
| + | The calculation of dihedral angles is very similar to the distance measurement. We first load the .psf and .dcd in VMD. | ||
| + | <br><br> | ||
| + | In the window which displays the protein, zoom on the region of interest, press "4" on your keyboard and select the four atoms within which you would like to calculate the dihedral angle. | ||
| + | <br> | ||
| + | Then, open the VMD window "label", select dihedral, click on the created dihedral, click on the tab "Graph" and finally save the calculated data. | ||
| + | |||
| + | <!-- By typing in the Tk Console window : | ||
| + | <br><span style="font-family: Courier;"> set sel [atomselect top "resid 1 2 3 4 and name CA"]<br> | ||
| + | $sel get index </span> | ||
| + | <br>This gives the indices of alpha carbons of residues 1, 2, 3 and 4. | ||
| + | <br> | ||
| + | Make the residues appear in the representation windows, then choose the Mouse → Label → Bonds menu item from the VMD Main menu. Click on each atom one after the other. | ||
| + | <br> | ||
| + | In VMD Main menu, select Graphics → Labels. By chosing <i>Dihedral angles</i> we select the angles labeled. The graph tab will create a plot of the evolution of angle between these atoms over time. --> | ||
| + | |||
</p> | </p> | ||
| Line 733: | Line 723: | ||
</html> | </html> | ||
| + | |} | ||
| + | <br><br> | ||
| + | {|class="wikitable" border="0" cellpadding="10" cellspacing="1" style="padding: 1px; background-color:#007CBC; text-align:center" | ||
| + | !width="20%" align="left" valign="top" style="background:#ffffff; color:black"| | ||
| + | == PCA Analysis == | ||
| + | |||
| + | PCA is a useful technique used for compression and data classification. | ||
| + | |||
| + | <html> | ||
| + | <script type="text/javascript" language="JavaScript"><!-- | ||
| + | function HideContent(d) { | ||
| + | document.getElementById(d).style.display = "none"; | ||
| + | } | ||
| + | function ShowContent(d) { | ||
| + | document.getElementById(d).style.display = "block"; | ||
| + | } | ||
| + | function ReverseDisplay(d) { | ||
| + | if(document.getElementById(d).style.display == "none") { document.getElementById(d).style.display = "block"; } | ||
| + | else { document.getElementById(d).style.display = "none"; } | ||
| + | } | ||
| + | //--></script> | ||
| + | <p> | ||
| + | <a href="javascript:ReverseDisplay('hs14')"> Click here to expand</a> | ||
| + | </p> | ||
| + | <div id="hs14" style="display:none;"> | ||
| + | <p> | ||
| + | <br> | ||
| + | |||
| + | The aim is to reduce the dimensionality (number of dimensions) of a data ensemble (sample), by finding a new set of variables with a smaller size than the original set of variables. However, this new set must contain the main part of the information: most of the information is kept in a smaller number of variables. | ||
| + | <br> | ||
| + | Information means variation in the sample, et given by the correlation between the original variables. The new variables are called principal components (PC), and are not correlated. They are given by splitting the total information contained in each one. | ||
| + | |||
| + | </p> | ||
| + | </div> | ||
| + | </html> | ||
| + | |||
| + | |} | ||
| + | <br><br> | ||
| + | |||
| + | <html> | ||
| + | <p align="center" class="style1"><a href="#top"><img src="https://static.igem.org/mediawiki/2009/thumb/0/06/Up_arrow.png/50px-Up_arrow.png" alt="Back to top" border="0"></a><br></p> | ||
| + | <br> | ||
| + | </html> | ||
</div><div CLASS="epfl09bouchon"></div> | </div><div CLASS="epfl09bouchon"></div> | ||
Latest revision as of 19:21, 21 October 2009


Softwares used
VMD
VMD is a molecular visualization program for displaying, animating, and analyzing biomolecular systems using 3-D graphics and built-in scripting. It provides a wide range of molecular representations, and includes tools for working with volumetric data, sequence data, and arbitrary graphics objects. You can have more information on their webpage.
NAMD
NAMD is a molecular dynamics code designed for simulation of large biomolecular systems. It is based on Charm++ parallel programming model, and uses VMD for simulation setup and trajectory analysis. See their website here.
Information needed
Generating input files
In this section, we explain all the steps to create needed files for NAMD, except the .conf file, which is just below. We need a compatible .pdb in addition to parameter and topology files to go through. Steps to generate all the input files are explained in detail on this page: How to generate input files. This is a kind of summary of the tutorial.
Launch a simulation
We start from .pdb, .psf, .rtf generated in the previous sections and we explain how to launch NAMD on both clusters we have access to. Complete process is on a separate page How to launch a simulation.
Namd .conf parameters
Namd can run different kind of simulations, from minimization to MD simulations. Here are the .conf file we used. NamdConf
Scripts used
We stored all our scripts, which were highly modified compared to the original ones, in order to fit our needs. You can find them on this page.
Step by step analysis
The following section is a kind of tutorial, which describes step by step how to obtain our different results.
This analysis will check whether the minimization, the heating and the equilibration took place correctly and whether the protein did not explode.
Maxwell-Boltzmann Energy DistributionHere we will confirm that the kinetic energy distribution of the atoms in a system corresponds to the Maxwell distribution for a given temperature. |
|---|


EnergiesHere we will calculate the average of various energies such as kinetic energy and different internal ones so called bonded energies (bonds, angles and dihedrals). Moreover, we will calculate non-bonded energy (electrostatic, van der Waals)) over the course of the equilibration. |
|---|
Temperature distributionHere we will analyze the temperature distribution over the simulation. The temperature might increase linearly during the heating step and then it might remain stable. We obtained the expected results.
|
|---|
DensityHere we will analyze the behavior of the protein density over the simulation. Normally during the equilibration step density might remain more or less stable. Particularly during the NVT equilibration the density might remain constant. We obtained the expected results. |
|---|
Pressure as a function of simulation timeHere we will analyze the pressure behavior along the minimization and the equilibration. This quantity might stabilize after the heating and remain more or less stable during the equilibration. Particularly during the NPT steps the pressure might be strictly constant. We obtained the expected results. |
|---|
RMSD for individual residuesHere we will calculate the RMSD for each residue to determine which residue move the most. This analysis will help us to see which residue is more or less stable. After that we will try after that to select the amino acids to mutate in order to stabilize the light activated state of our LOV domain. Click here to see the results. |
|---|
RMSD of selected atoms compared to initial position along timeHere we will analyze the RMSD of each atom to check whether the protein remains more or less stable during the equilibration. Click here to see the results for the dark state simulation. Click here to see the results for the light state simulation.
|
|---|
Salt bridgesSalt bridges are non-bonded interactions between charged residues. Here we will analyze the evolution of these interactions over the equilibration in order to check how these interactions change over the equilibration. Click here to see the results.
|
|---|
RMSFThis is quite similar to the RMSD analysis. Here we will analyze how the RMSF vary for each residues. Click here to see the results for the dark state simulation. Click here to see the results for the light state simulation.
|
|---|

AnglesThis part is made to measure the angle between two chains. The procedure is described below. Click here to see the results for the dark state simulation. Click here to see the results for the light state simulation. |
|---|
H bonds and distance measurmentsThis part aim at finding characteristic distances, in particular for H-bonds. Click here to see the results for the dark state simulation.
|
|---|
Dihedral anglesDihedral angles measure angle between four atoms. Click here to see the results for the dark state simulation. Click here to see the results for the light state simulation.
|
|---|
PCA AnalysisPCA is a useful technique used for compression and data classification.
|
|---|
![]()