Results
- 1. Synthetic Circuit - I : pSB3C5/Pars-gfp-Pznt-rfp
- 1)Pznt-rfp
| Zn2+ (mM)
| 0
| 0.5
| 0.75
| 1
| 1.5
| 2
|
| OD600
| 0.490 ± 0.003
| 0.459 ± 0.004
| 0.433 ± 0.008
| 0.418 ± 0.005
| 0.275 ± 0.011
| 0.243 ± 0.008
|
| Red fluorescence (RF)
| 26628 ± 706
| 27856 ± 292
| 29333 ± 292
| 31217 ± 66
| 46044 ± 237
| 49188 ± 174
|
| OD600/RF
| 54376 ± 1203
| 60646 ± 787
| 67803 ± 573
| 74687 ± 755
| 167833 ± 7202
| 202565 ± 6428
|
| Background
| 0
| 6270 ± 520
| 13427 ± 1719
| 20311 ± 475
| 113457 ± 6016
| 148189 ± 6731
|
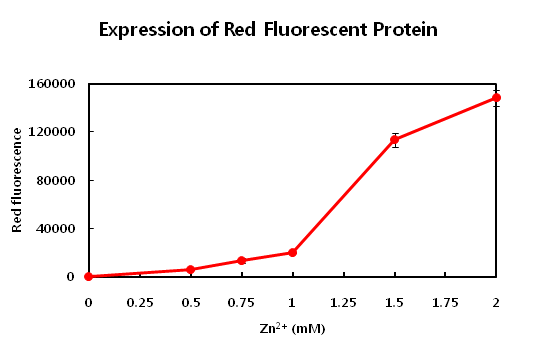
- This parts is producing red fluorosence based on the zinc ion level. The zinc detecting promoter can be
- induced beyond 1mM concentration of zinc ion. This range from 1mM to 2mM is proper to detect zinc level on
- the common waste water. Maybe it is required to detect the upper concentration of zinc ion in waste water that
- using the dilution method which dilute the level of zinc concentration. If the level curve is too rugh or not
- too much change according to concentraion, you need to apply dilution or concentration of sample.
-
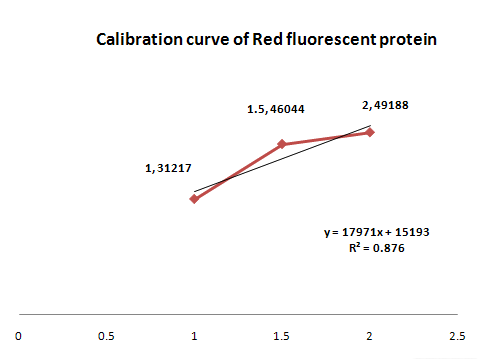
- Thenm, the value of R square is 0.876. Although it is not a satisfied enough for confidence, we can make new
- formula Absorbance(fluorsence) = 17971x + 15193. x means the concentration of zinc ion(unit:mM).
- 2)Pars-gfp
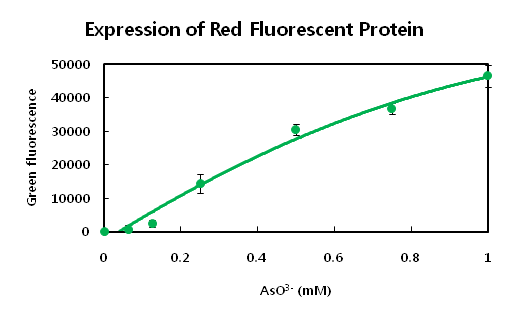
- Differing from zinc ion, Arsenic ion is more severe impact on the E.coli. When microbials are exposed by
- arsenic ion even 1mM concentration, This concentraion of arsenic ion is already full of toxicity. It is very
- senstive to detect arsenic ion. It means that arsenic ion can provide strong harmful effect on the organism
- even microbial which is known as the best survivor on the earth. The interaction of arsenic ion is participated
- in more than two or more group of proteins or others. See the curve of fluorosence of GFP.the level curve is
- show sigmoid curve form.
-
- It is supose that the the cost of the expression of arsenic ion binder is very expensive for microbial.
- Because even lower level of concentraion the fluorosence curve did not show regression curve at the initiation
- point. Strong inhibitor can be exist at the initation of expression state.
-
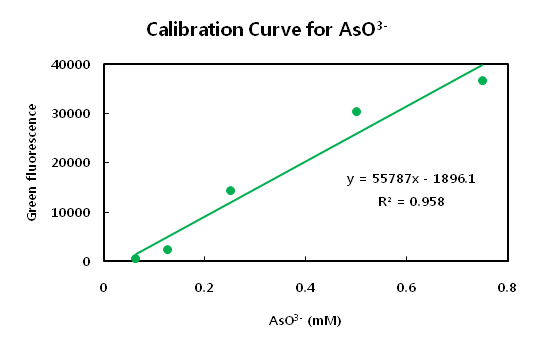
- The main point of this idea is that the possible measure range. Although the view of whole curve show sigmoid
- curve, the range from 0.15 to 0.5 mM concentration of arsenic ion show regression. We can utilize this midpoint
- of curve to measuring arsenic ion rather than endpoint of this curve. Also we can use the dilution method if the sample contain too much concentration of arsenic ion.
-
- We belive that the hypothesis can be accepted we just explain above. Because the population size of E.coli
- could determine the intensity of fluorosence. Comparing to zinc ion, the arsenic ion is more harmful effect on
- the growth of bacteria. This point is the very critical delema in terms of that the bacteria can be killed by
- the measuring molecules. It is hard to distinguish whether the effect of concentration of sample or death rate
- of bacteria.
| AsO3- (mM)
| 0
| 0.00625
| 0.125
| 0.25
| 0.5
| 0.75
| 1
|
| OD600
| 0.553 ± 0.009
| 0.519 ± 0.002
| 0.480 ± 0.005
| 0.395 ± 0.007
| 0.315 ± 0.006
| 0.286 ± 0.004
| 0.273 ± 0.006
|
| Green fluorescence (GF)
| 27740 ± 226
| 26411 ± 169
| 25267 ± 267
| 25536 ± 213
| 25407 ± 259
| 24849 ± 152
| 26479 ± 149
|
| OD600/GF
| 50206 ± 1225
| 50855 ± 123
| 52606 ± 689
| 64669 ± 1684
| 80665 ± 603
| 86897 ± 1321
| 96784 ± 2165
|
| Background
| 0
| 648 ± 1314
| 2399 ± 969
| 14463 ± 2896
| 30459 ± 1631
| 36691 ± 1636
| 46578 ± 3220
|
- 2.Synthetic circuit – II : PyodA-AMD
| Cd2+ (mM)
| 0
| 0.05
| 0.1
| 0.2
| 0.4
| 0.8
|
| OD615
| 0.242 ± 0.005
| 0.258 ± 0.008
| 0.274 ± 0.011
| 0.284 ± 0.01
| 0.293 ± 0.011
| 0.302 ± 0.01
|
| Background
| 0
| 0.016 ± 0.004
| 0.032 ± 0.006
| 0.043 ± 0.005
| 0.052 ± 0.007
| 0.060 ± 0.007
|
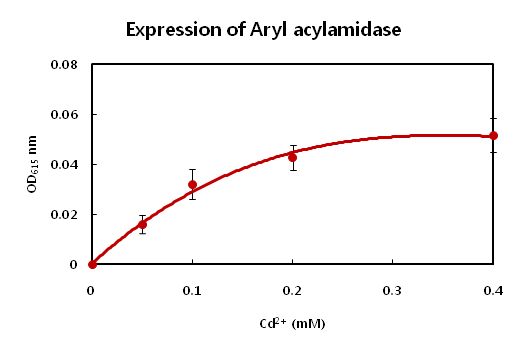
- Cadimum detector has similar problem related to the toxicity issue just above result. Also cadimum ion has
- harmful effect on the even bacteria. 0.2mM of concentration of cadimum is enough to inhibt the growth of
- E.coli. The E.coli did not show big difference at between 0.2mM and 0.4mM of concentration of cadimum.
- In addition,we try to show the change according to the concentration of cadimum ion in the sample with naked
- eye. Amd gene which can convert form acetoaminpen to brwon color only demonstrate the possiblity to those
- hypothesis. Although we know the more strong promoter to interact heavy metals, we do not use this due to
- standards issue. Some parts from MIT did not work even not accurate sequenced.
- GFP and RFP fluorsence can see only with UV irritation.
- 3.summary
-
|
 "
"


