Results
- 1. Synthetic Circuit - I : pSB3C5/Pars-gfp-Pznt-rfp
- 1)Pznt-rfp
| Zn2+ (mM)
| 0
| 0.5
| 0.75
| 1
| 1.5
| 2
|
| OD600
| 0.490 ± 0.003
| 0.459 ± 0.004
| 0.433 ± 0.008
| 0.418 ± 0.005
| 0.275 ± 0.011
| 0.243 ± 0.008
|
| Red fluorescence (RF)
| 26628 ± 706
| 27856 ± 292
| 29333 ± 292
| 31217 ± 66
| 46044 ± 237
| 49188 ± 174
|
| OD600/RF
| 54376 ± 1203
| 60646 ± 787
| 67803 ± 573
| 74687 ± 755
| 167833 ± 7202
| 202565 ± 6428
|
| Background
| 0
| 6270 ± 520
| 13427 ± 1719
| 20311 ± 475
| 113457 ± 6016
| 148189 ± 6731
|
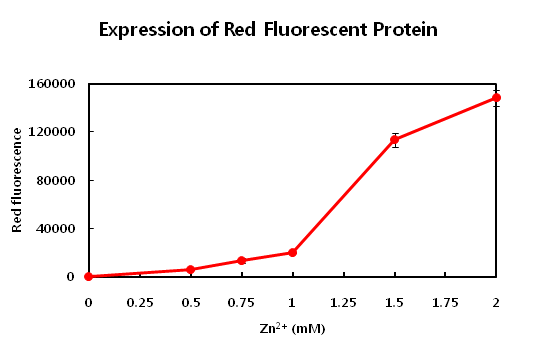
- This parts is producing red fluorosence based on the zinc ion level. The zinc detecting promoter can be
- induced beyond 1mM concentration of zinc ion. This range from 1mM to 2mM is proper to detect zinc level on
- the common waste water. Maybe it is required to detect the upper concentration of zinc ion in waste water that
- using the dilution method which dilute the level of zinc concentration. If the level curve is too rugh or not
- too much change according to concentraion, you need to apply dilution or concentration of sample.
-
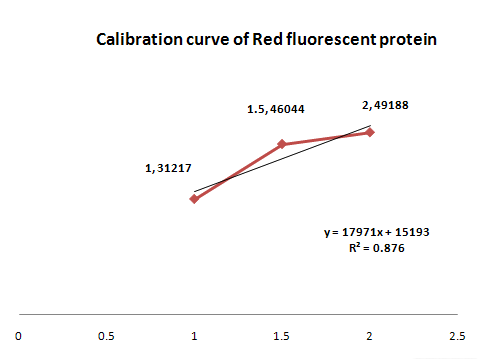
- Thenm, the value of R square is 0.876. Although it is not a satisfied enough for confidence, we can make new
- formula Absorbance(fluorsence) = 17971x + 15193. x means the concentration of zinc ion(unit:mM).
- If you get a sample show specific absorbance, you can calculate the concentration of zinc ion indirect way.
- If you think the sample contain large amount of zinc ion, you can try another pathway to measure concentration of zinc ion. First, dilute the sample as serise of dilution (ex, 10^-1, 10^-2, 10^-3 ...). Second, find the absorbance value between 1,31217 and 2,49188. Then calculate the concentration inversely.
-
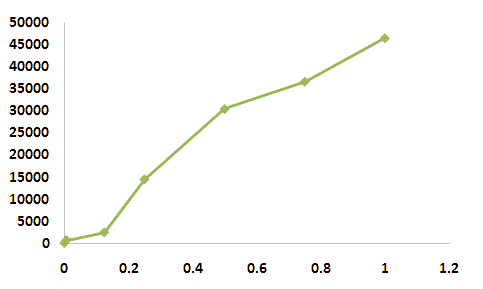
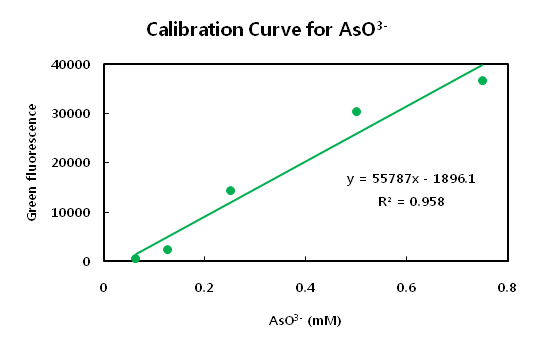
- 2)Pars-gfp
- Differing from zinc ion, Arsenic ion is more severe impact on the E.coli. When microbials are exposed by
- arsenic ion even 1mM concentration, This concentraion of arsenic ion is already full of toxicity. It is very
- senstive to detect arsenic ion. It means that arsenic ion can provide strong harmful effect on the organism
- even microbial which is known as the best survivor on the earth. The interaction of arsenic ion is participated
- in more than two or more group of proteins or others. See the curve of fluorosence of GFP.the level curve is
- show sigmoid curve form.
-
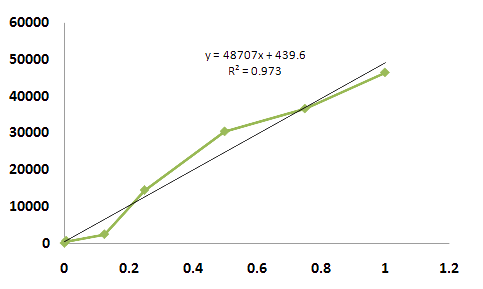
- It is supose that the the cost of the expression of arsenic ion binder is very expensive for microbial.
- Because even lower level of concentraion the fluorosence curve did not show regression curve at the initiation
- point. Strong inhibitor can be exist at the initation of expression state.
-
- The main point of this idea is that the possible measure range. Although the view of whole curve show sigmoid
- curve, the range from 0.15 to 0.5 mM concentration of arsenic ion show regression. We can utilize this midpoint
- of curve to measuring arsenic ion rather than endpoint of this curve. Also we can use the dilution method if the sample contain too much concentration of arsenic ion.
-
- We belive that the hypothesis can be accepted we just explain above. Because the population size of E.coli
- could determine the intensity of fluorosence. Comparing to zinc ion, the arsenic ion is more harmful effect on
- the growth of bacteria. This point is the very critical delema in terms of that the bacteria can be killed by
- the measuring molecules. It is hard to distinguish whether the effect of concentration of sample or death rate
- of bacteria.
| AsO3- (mM)
| 0
| 0.00625
| 0.125
| 0.25
| 0.5
| 0.75
| 1
|
| OD600
| 0.553 ± 0.009
| 0.519 ± 0.002
| 0.480 ± 0.005
| 0.395 ± 0.007
| 0.315 ± 0.006
| 0.286 ± 0.004
| 0.273 ± 0.006
|
| Green fluorescence (GF)
| 27740 ± 226
| 26411 ± 169
| 25267 ± 267
| 25536 ± 213
| 25407 ± 259
| 24849 ± 152
| 26479 ± 149
|
| OD600/GF
| 50206 ± 1225
| 50855 ± 123
| 52606 ± 689
| 64669 ± 1684
| 80665 ± 603
| 86897 ± 1321
| 96784 ± 2165
|
| Background
| 0
| 648 ± 1314
| 2399 ± 969
| 14463 ± 2896
| 30459 ± 1631
| 36691 ± 1636
| 46578 ± 3220
|
- 2.Synthetic circuit – II : PyodA-AMD
| Cd2+ (mM)
| 0
| 0.05
| 0.1
| 0.2
| 0.4
| 0.8
|
| OD615
| 0.242 ± 0.005
| 0.258 ± 0.008
| 0.274 ± 0.011
| 0.284 ± 0.01
| 0.293 ± 0.011
| 0.302 ± 0.01
|
| Background
| 0
| 0.016 ± 0.004
| 0.032 ± 0.006
| 0.043 ± 0.005
| 0.052 ± 0.007
| 0.060 ± 0.007
|
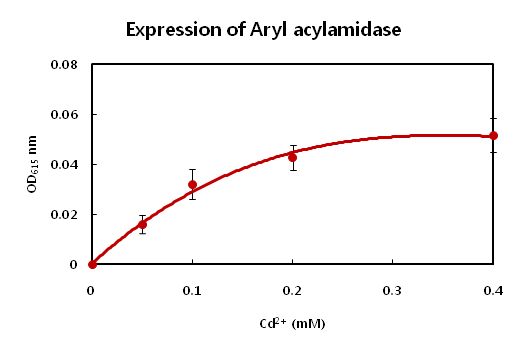
- Cadimum detector has similar problem related to the toxicity issue just above result. Also cadimum ion has
- harmful effect on the even bacteria. 0.2mM of concentration of cadimum is enough to inhibt the growth of
- E.coli. The E.coli did not show big difference at between 0.2mM and 0.4mM of concentration of cadimum.
- In addition,we try to show the change according to the concentration of cadimum ion in the sample with naked
- eye. Amd gene which can convert form acetoaminpen to brwon color only demonstrate the possiblity to those
- hypothesis. Although we know the more strong promoter to interact heavy metals, we do not use this due to
- standards issue. Some parts from MIT did not work even not accurate sequenced.
- GFP and RFP fluorsence can see only with UV irritation.
- 3.summary
-
|
 "
"


